7
60
70
80
90
100
110
120
130
140
50
60
70
80
90
100
Gamut (Rg)
Fidelity (Rf)
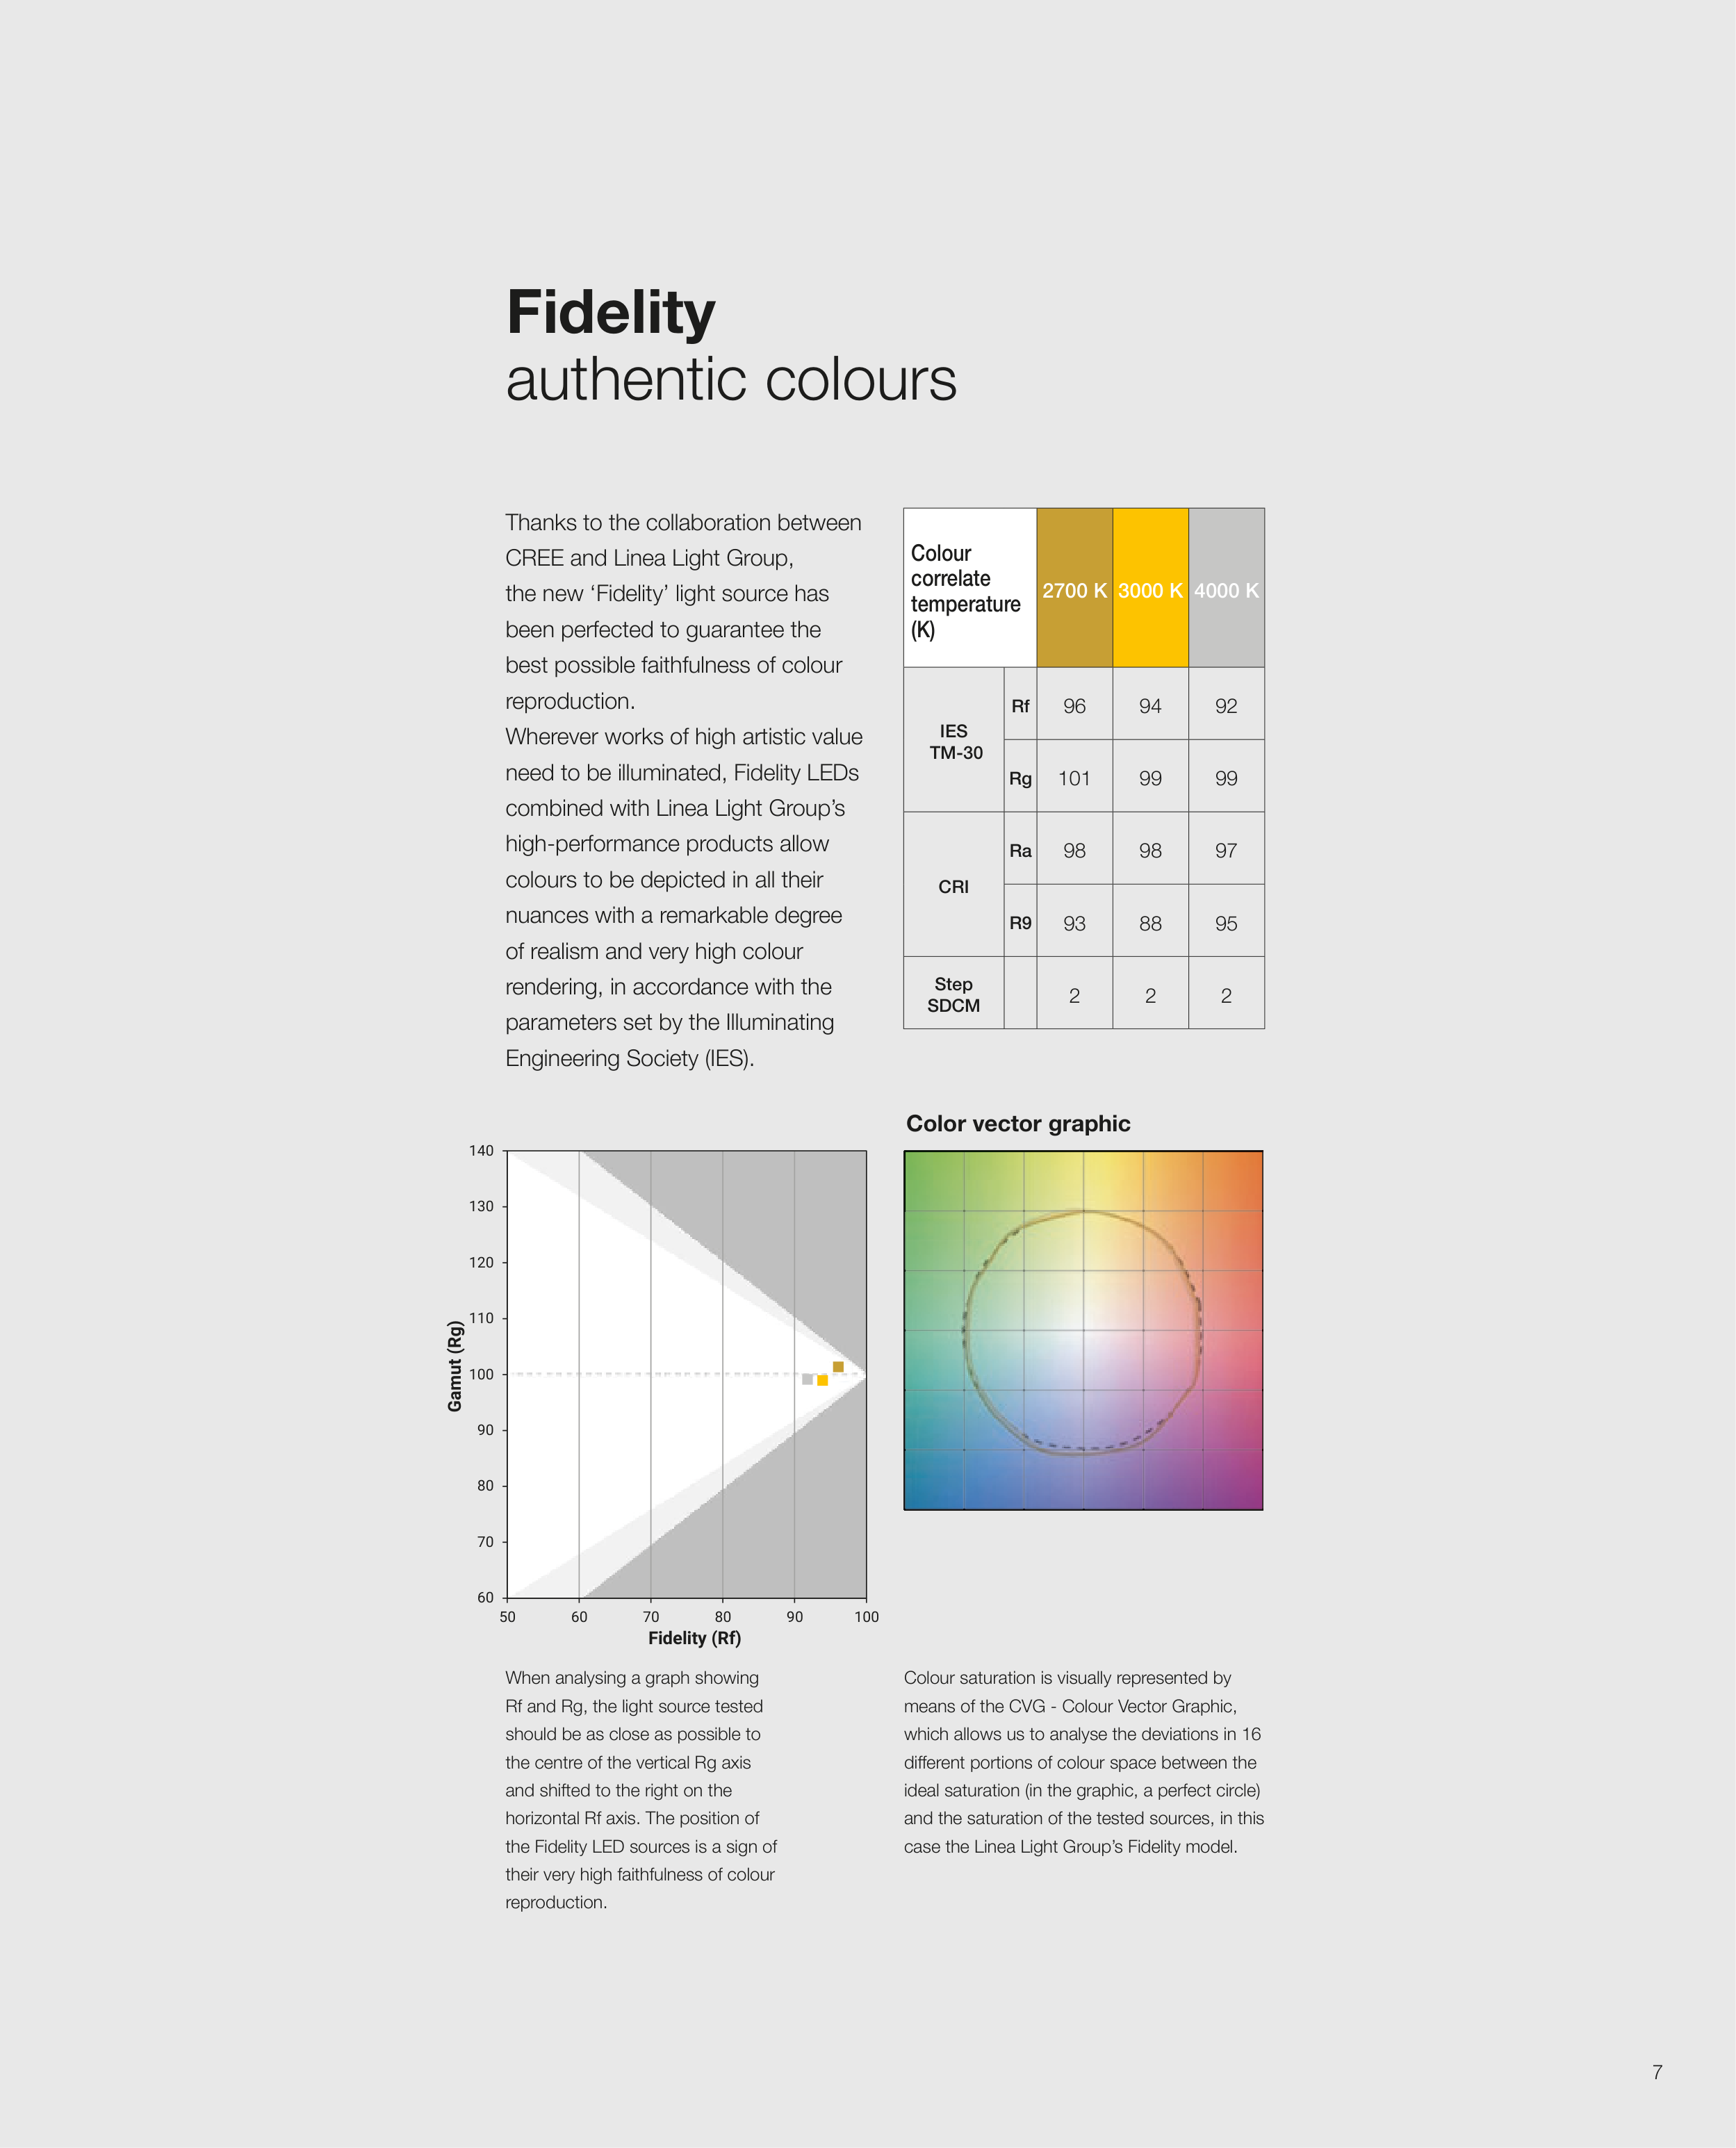
Color vector graphic
When analysing a graph showing
Rf and Rg, the light source tested
should be as close as possible to
the centre of the vertical Rg axis
and shifted to the right on the
horizontal Rf axis. The position of
the Fidelity LED sources is a sign of
their very high faithfulness of colour
reproduction.
Thanks to the collaboration between
CREE and Linea Light Group,
the new ‘Fidelity’ light source has
been perfected to guarantee the
best possible faithfulness of colour
reproduction.
Wherever works of high artistic value
need to be illuminated, Fidelity LEDs
combined with Linea Light Group’s
high-performance products allow
colours to be depicted in all their
nuances with a remarkable degree
of realism and very high colour
rendering, in accordance with the
parameters set by the Illuminating
Engineering Society (IES).
Colour saturation is visually represented by
means of the CVG - Colour Vector Graphic,
which allows us to analyse the deviations in 16
diff erent portions of colour space between the
ideal saturation (in the graphic, a perfect circle)
and the saturation of the tested sources, in this
case the Linea Light Group’s Fidelity model.
Colour
correlate
temperature
(K)
2700 K 3000 K 4000 K
IES
TM-30
Rf
96
94
92
Rg
101
99
99
CRI
Ra
98
98
97
R9
93
88
95
Step
SDCM
2
2
2
Fidelity
authentic colours