IES TM 30
Colour vector image
Colour distortion icon
CES 01
CES 03
CES 05
CES 07
CES 09
CES 11
CES 13
CES 15
CES 17
CES 19
CES 21
CES 23
CES 25
CES 27
CES 29
CES 31
CES 33
CES 35
CES 37
CES 39
CES 41
CES 43
CES 45
CES 47
CES 49
CES 51
CES 53
CES 55
CES 57
CES 59
CES 61
CES 63
CES 65
CES 67
CES 69
CES 71
CES 73
CES 75
CES 77
CES 79
CES 81
CES 83
CES 85
CES 87
CES 89
CES 91
CES 93
CES 95
CES 97
CES 99
10
0
20
Colour Fidelity, Rf
Colour Evaluation Sample
30
40
50
60
70
80
90
100
Rg
Rf
140
130
120
110
100
100
90
90
80
80
70
70
60
60
Rg
50
Rf Farbtreue
Farbtonumfang (Sättigung)
983
xal.com/know-how
DE Die Farbwiedergabe Bewertung TM 30 ist als Ergän-
zung zur Farbwiedergabebewertung CIE 13.3 gedacht und
ist vor allem im amerikanisch-pazifischen Raum etabliert.
Statt acht Testfarben wurden 99 Testfarben gewählt,
die im täglichen Leben vorkommen. Der Mittelwert aus
allen 99 Testfarben wird als Rf ausgegeben (f für Fidelity
= Farbtreue). Um auch die Farbsättigung bewerten zu
können ist der Rg-Wert (g für Gamut = Farbtonumfang)
definiert worden. Diese beiden Werte werden gemeinsam
ermittelt. Beim Rf ist der höchste Wert 100; bei Rg ist theo-
retisch ein Maximalwert von 140 möglich. Je näher der
Rf-Wert an dem Maximalwert von 100 heranreicht, umso
näher liegt auch der Rg-Wert beim Maximum von 100.
DE Die rote Linie zeigt die Ergeb-
nisse der Test-Lichtquelle. Die
Abweichung von Test-Lichtquelle
zur Referenz ist erkennbar und
wird durch Pfeile markiert.
DE Die Referenz ist eine weiße
Linie auf schwarzem Grund. Die
Über-, bzw. Untersättigung ist sehr
klar sichtbar.
DE Grüner Punkt: höchste Licht-
qualität; bis gelb strichlierte Linie:
sehr gute Lichtqualität; bis rot
strichlierte Linie gute Lichtqualität.
pinker Bereich: Typische CRI ≥ 80
Leuchtmittel liegen etwas unter
dem Wert von Rf 80 und haben
eine geringe Sättigung von Rg 80
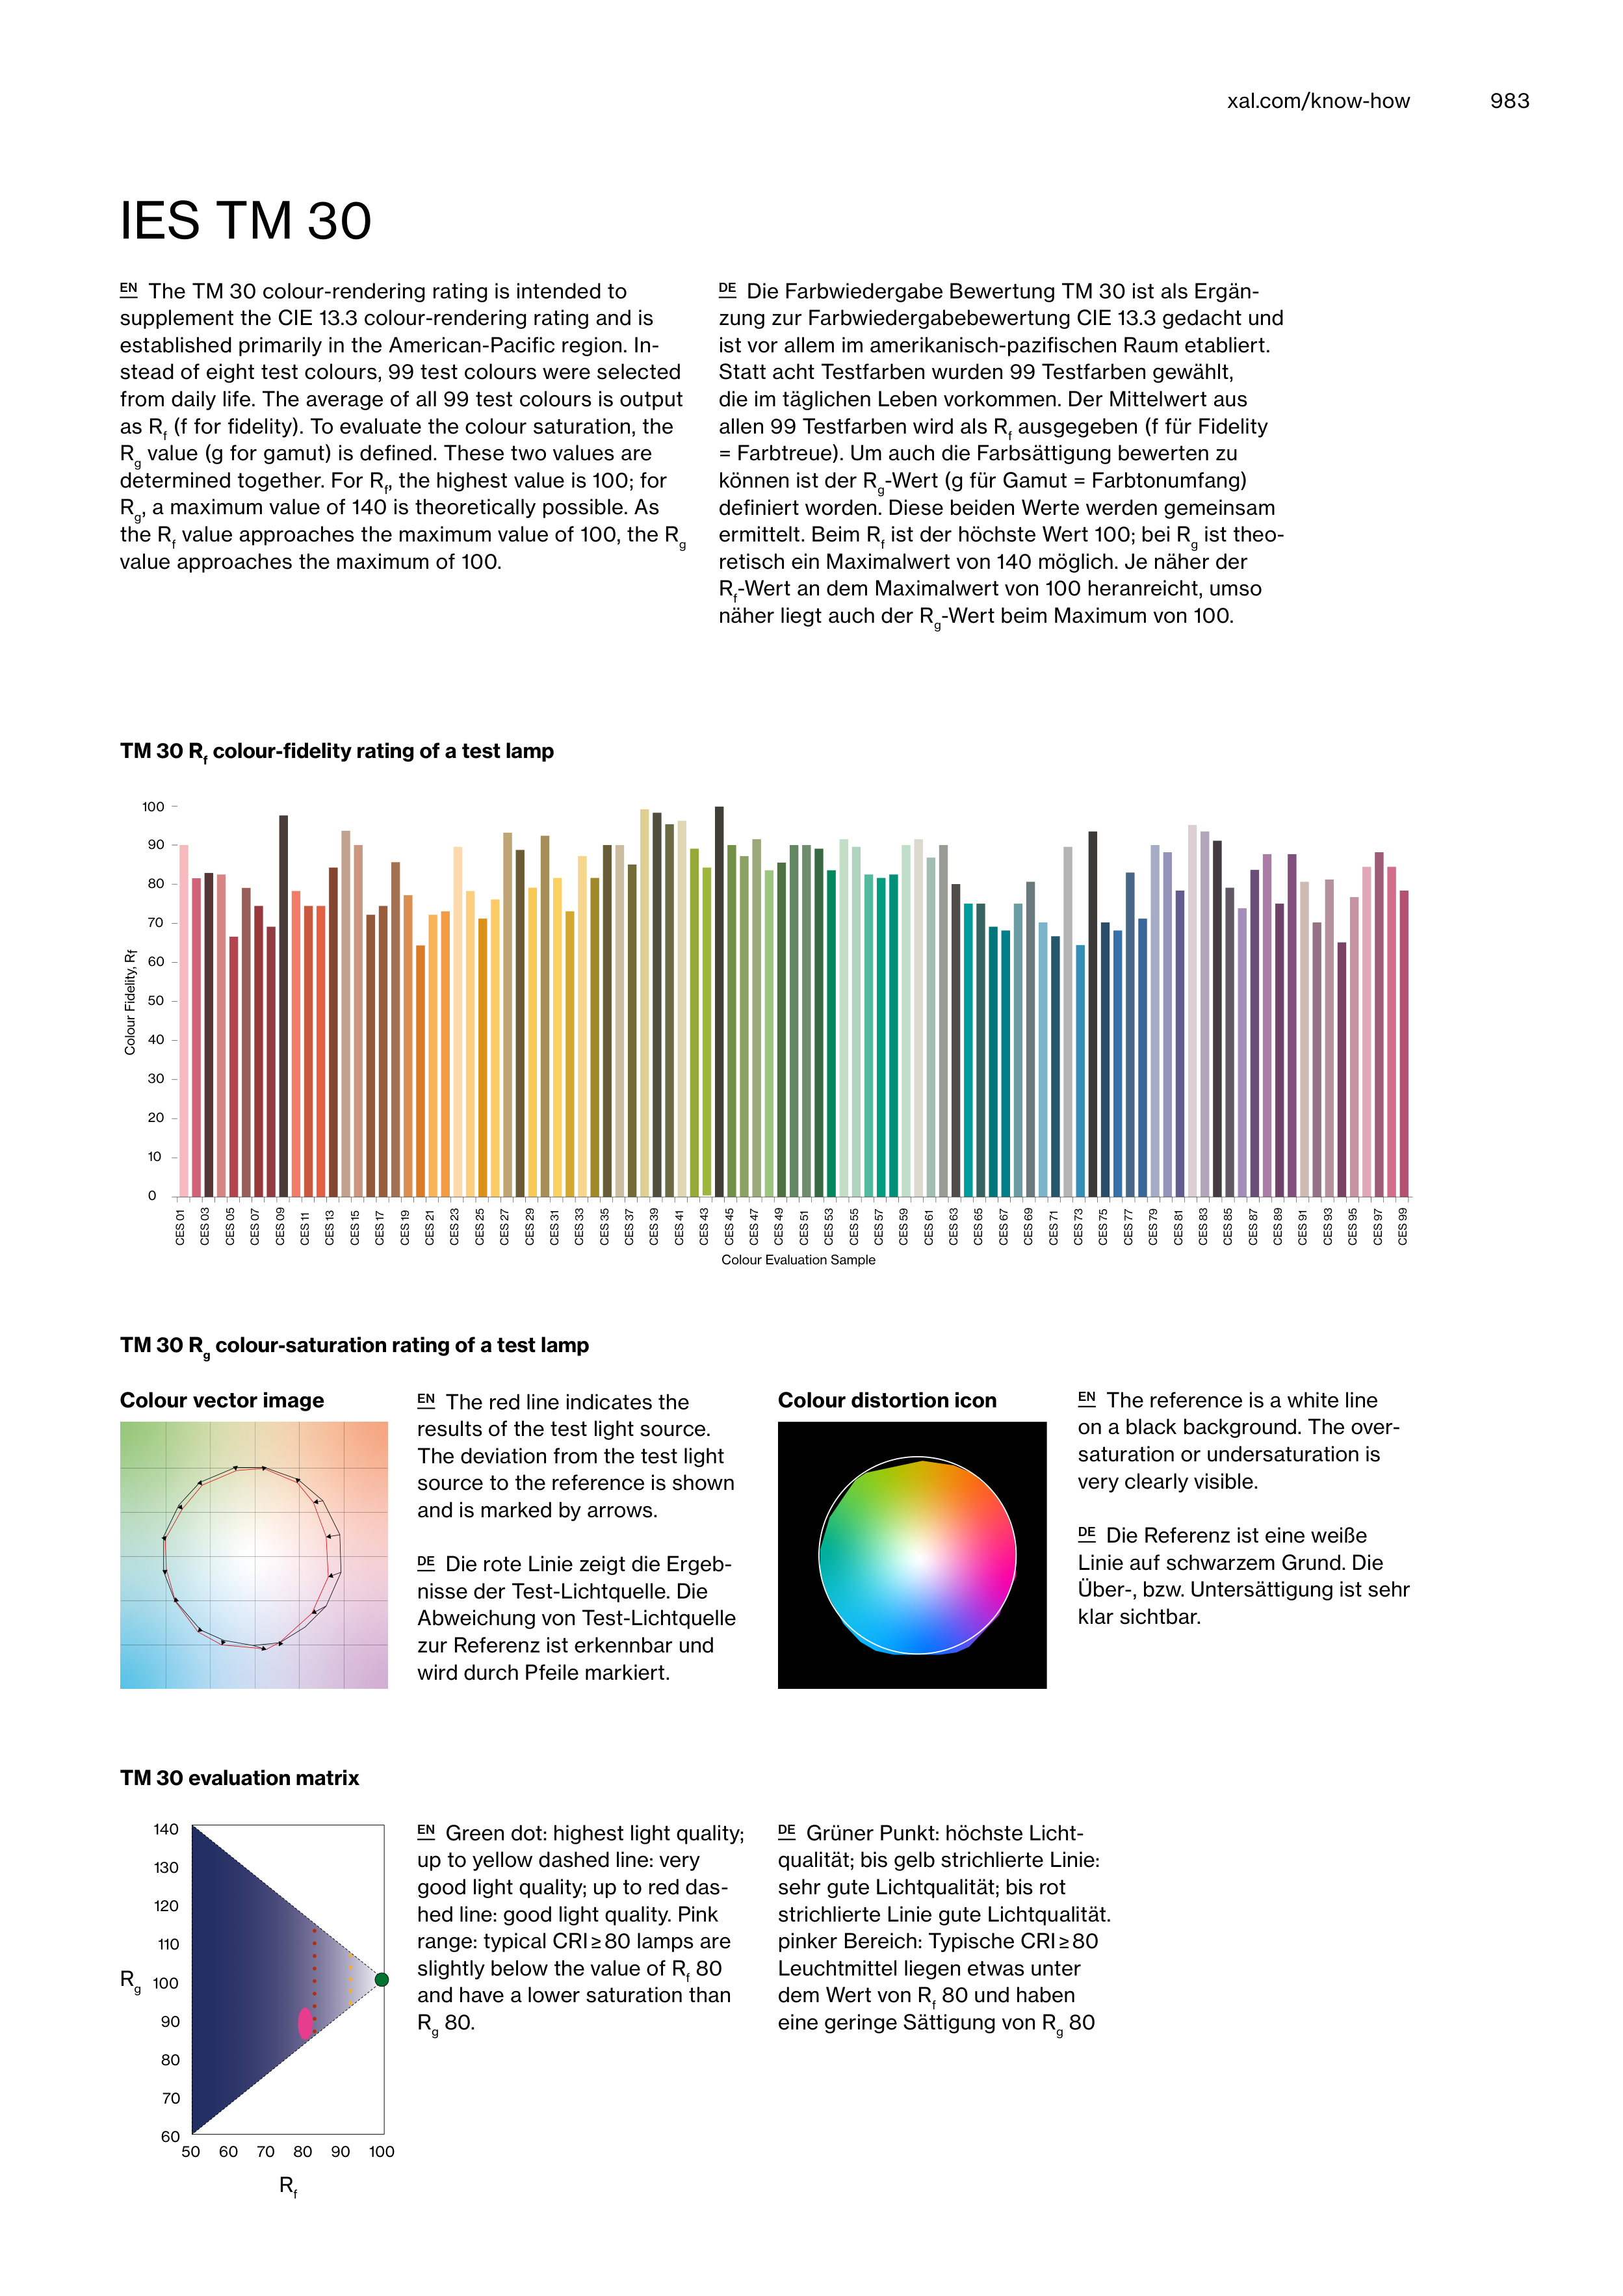
EN The TM 30 colour-rendering rating is intended to
supplement the CIE 13.3 colour-rendering rating and is
established primarily in the American-Pacific region. In-
stead of eight test colours, 99 test colours were selected
from daily life. The average of all 99 test colours is output
as Rf (f for fidelity). To evaluate the colour saturation, the
Rg value (g for gamut) is defined. These two values are
determined together. For Rf, the highest value is 100; for
Rg, a maximum value of 140 is theoretically possible. As
the Rf value approaches the maximum value of 100, the Rg
value approaches the maximum of 100.
TM 30 Rg colour-saturation rating of a test lamp
EN The red line indicates the
results of the test light source.
The deviation from the test light
source to the reference is shown
and is marked by arrows.
EN The reference is a white line
on a black background. The over-
saturation or undersaturation is
very clearly visible.
EN Green dot: highest light quality;
up to yellow dashed line: very
good light quality; up to red das-
hed line: good light quality. Pink
range: typical CRI ≥ 80 lamps are
slightly below the value of Rf 80
and have a lower saturation than
Rg 80.
TM 30 evaluation matrix
TM 30 Rf colour-fidelity rating of a test lamp


