LIGHTING SYSTEMS
JANE LED TAPE
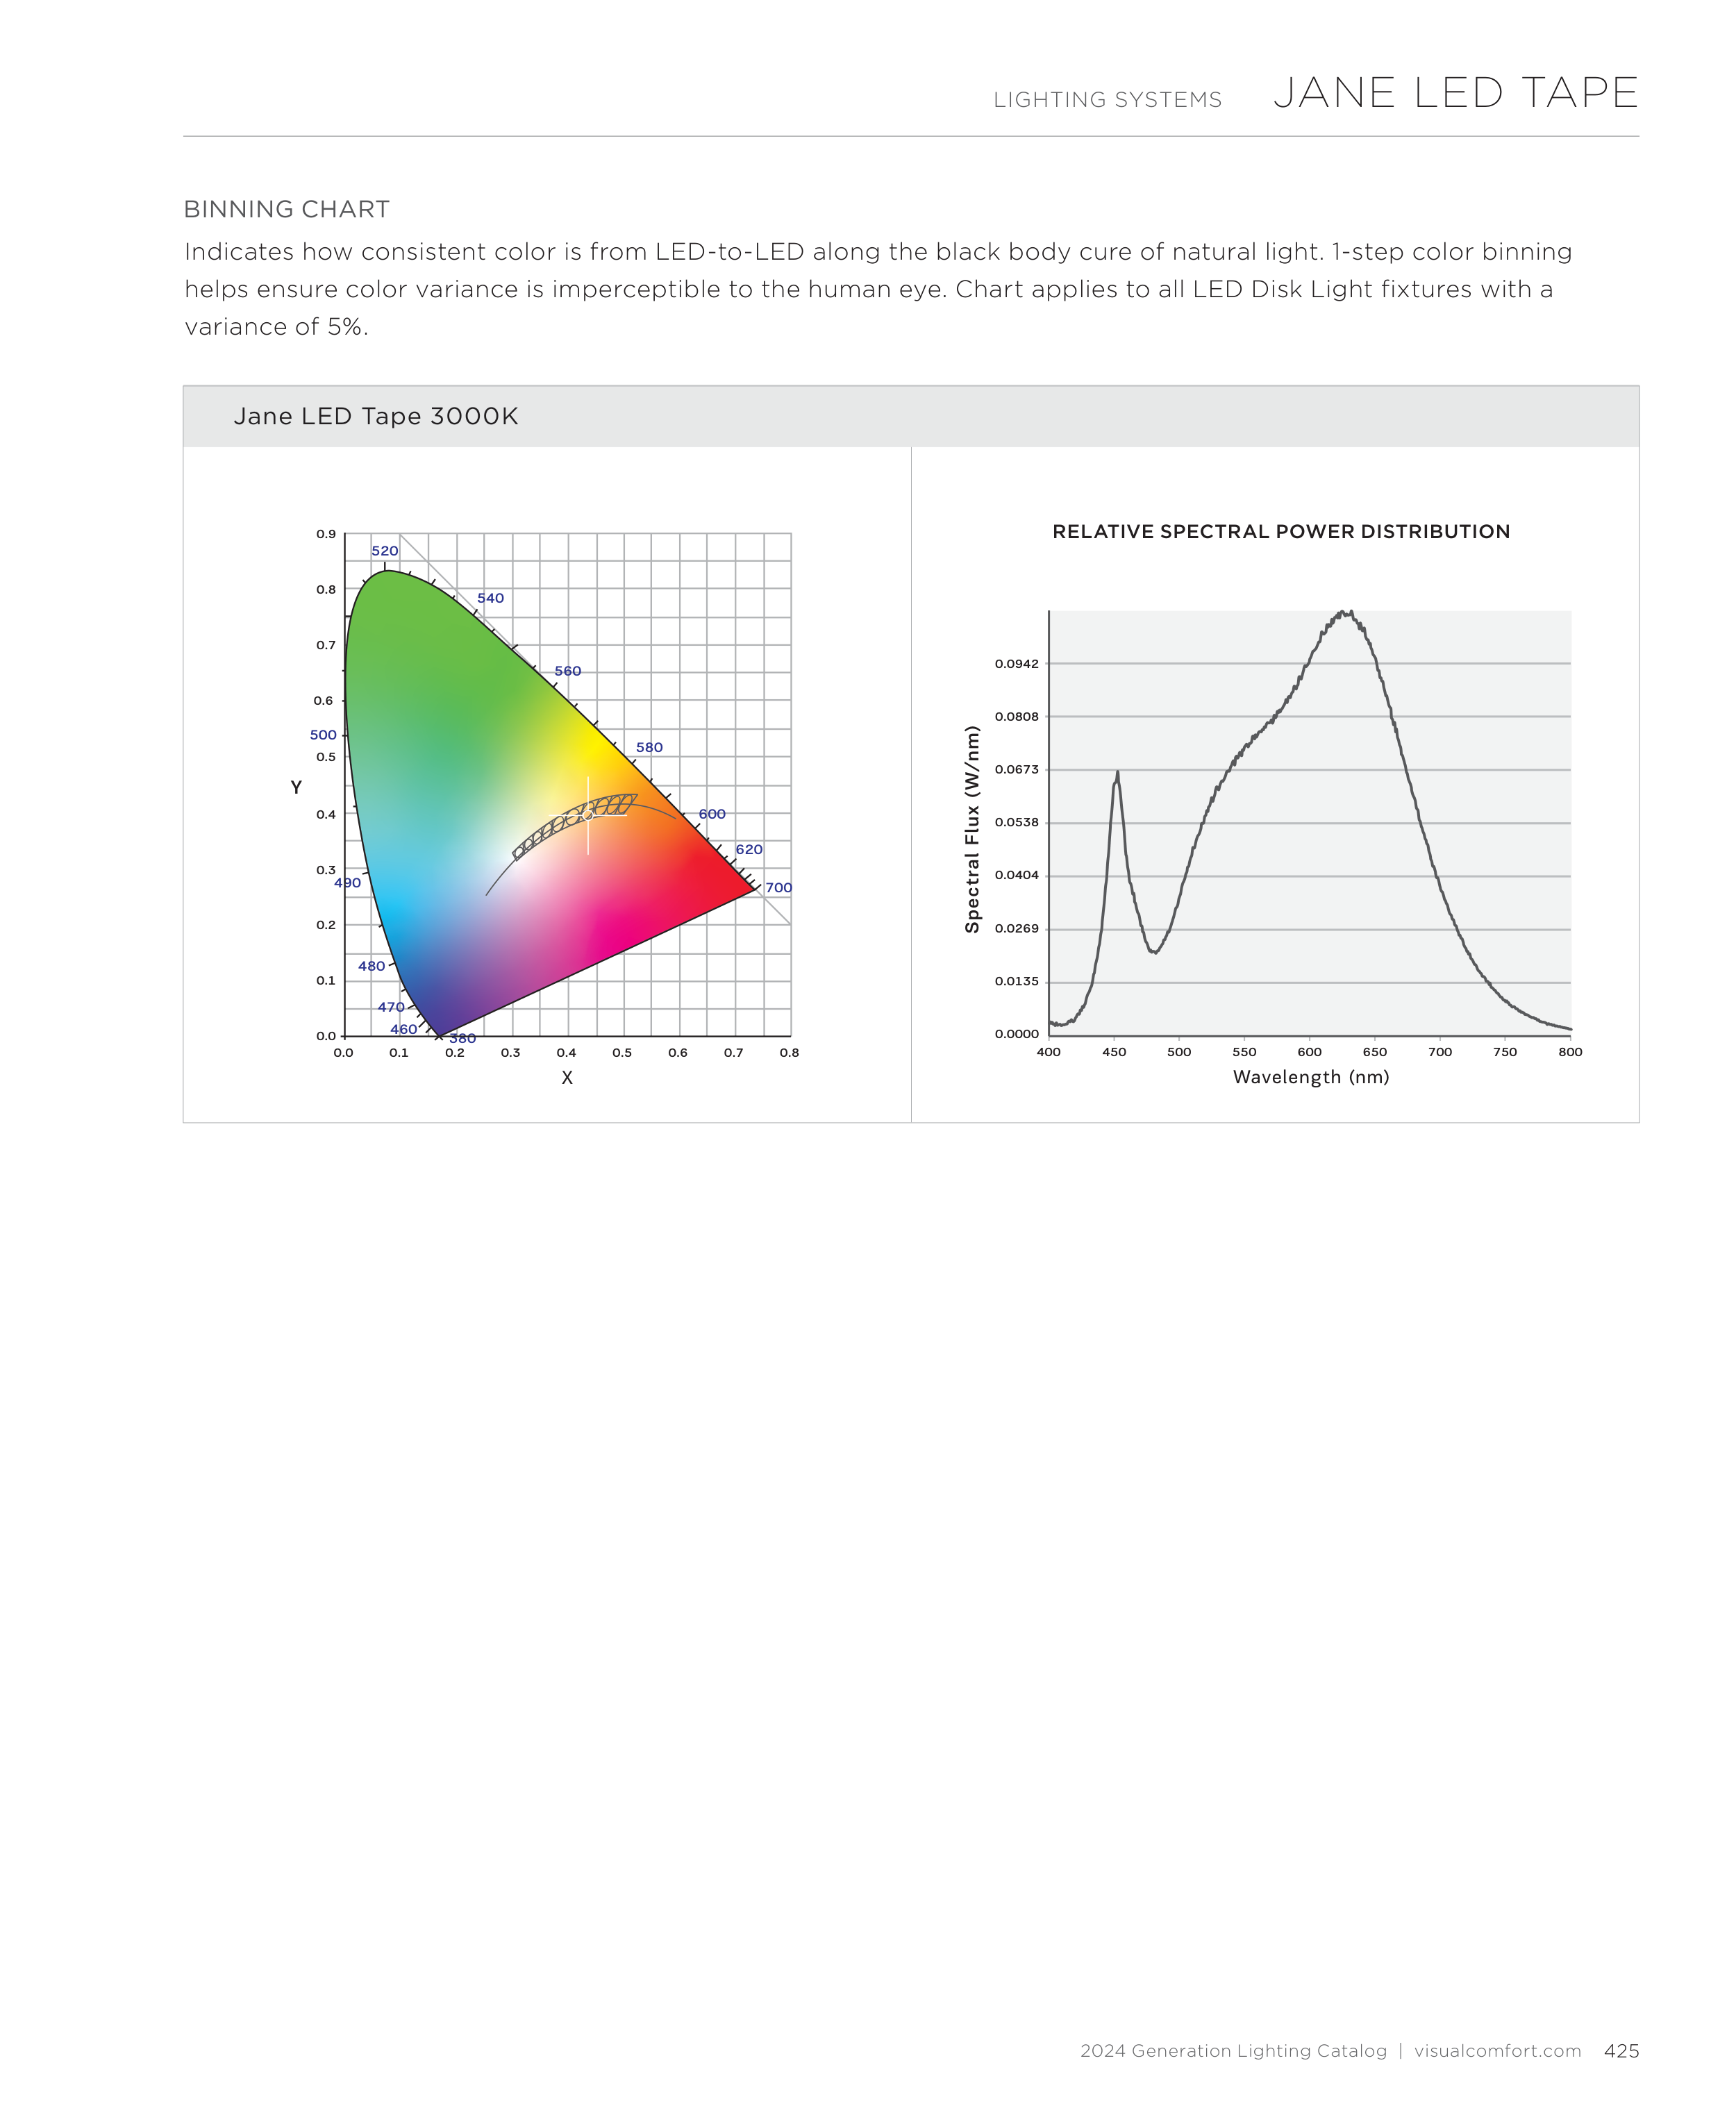
RELATIVE SPECTRAL POWER DISTRIBUTION
Indicates how consistent color is from LED-to-LED along the black body cure of natural light. 1-step color binning
helps ensure color variance is imperceptible to the human eye. Chart applies to all LED Disk Light fixtures with a
variance of 5%.
BINNING CHART
Jane LED Tape 3000K
0.0
0.0
0.1
0.2
0.3
0.4
0.5
0.6
500
520
540
560
580
600
620
700
490
480
470
460
380
0.7
0.8
0.9
0.1
0.2
0.3
0.4
0.5
0.6
0.7
0.8
Y
X
Spectral Flux (W/nm)
Wavelength (nm)
400
450
500
550
600
650
700
750
800
0.0942
0.0808
0.0673
0.0538
0.0404
0.0269
0.0135
0.0000
425
2024 Generation Lighting Catalog | visualcomfort.com