Exenia always keeps up with the latest lighting technologies
in order to meet the various needs of its customers. For this
reason, we are pleased to make the VIVID series available,
the latest generation of LED chip on board. This version of
LED allows the viewer to distinguish a wider range of colours,
compared to traditional light sources, rendering colours
and textures even more vivid. It is easy to imagine the great
interest it may arouse for commercial and decorative uses.
The colour seen seems more saturated but actually there is a
greater perception of the range of visible colours, making the
image more pleasant and defined.
CRI Vs CQS
So far, the evaluation of colour rendering by light sources has
been entrusted to CRI (Colour Rendering Index), inadequate
for describing rendering by solid-state sources. This makes
a real assessment of LED technology and comparison
with traditional light sources impossible. The evaluation
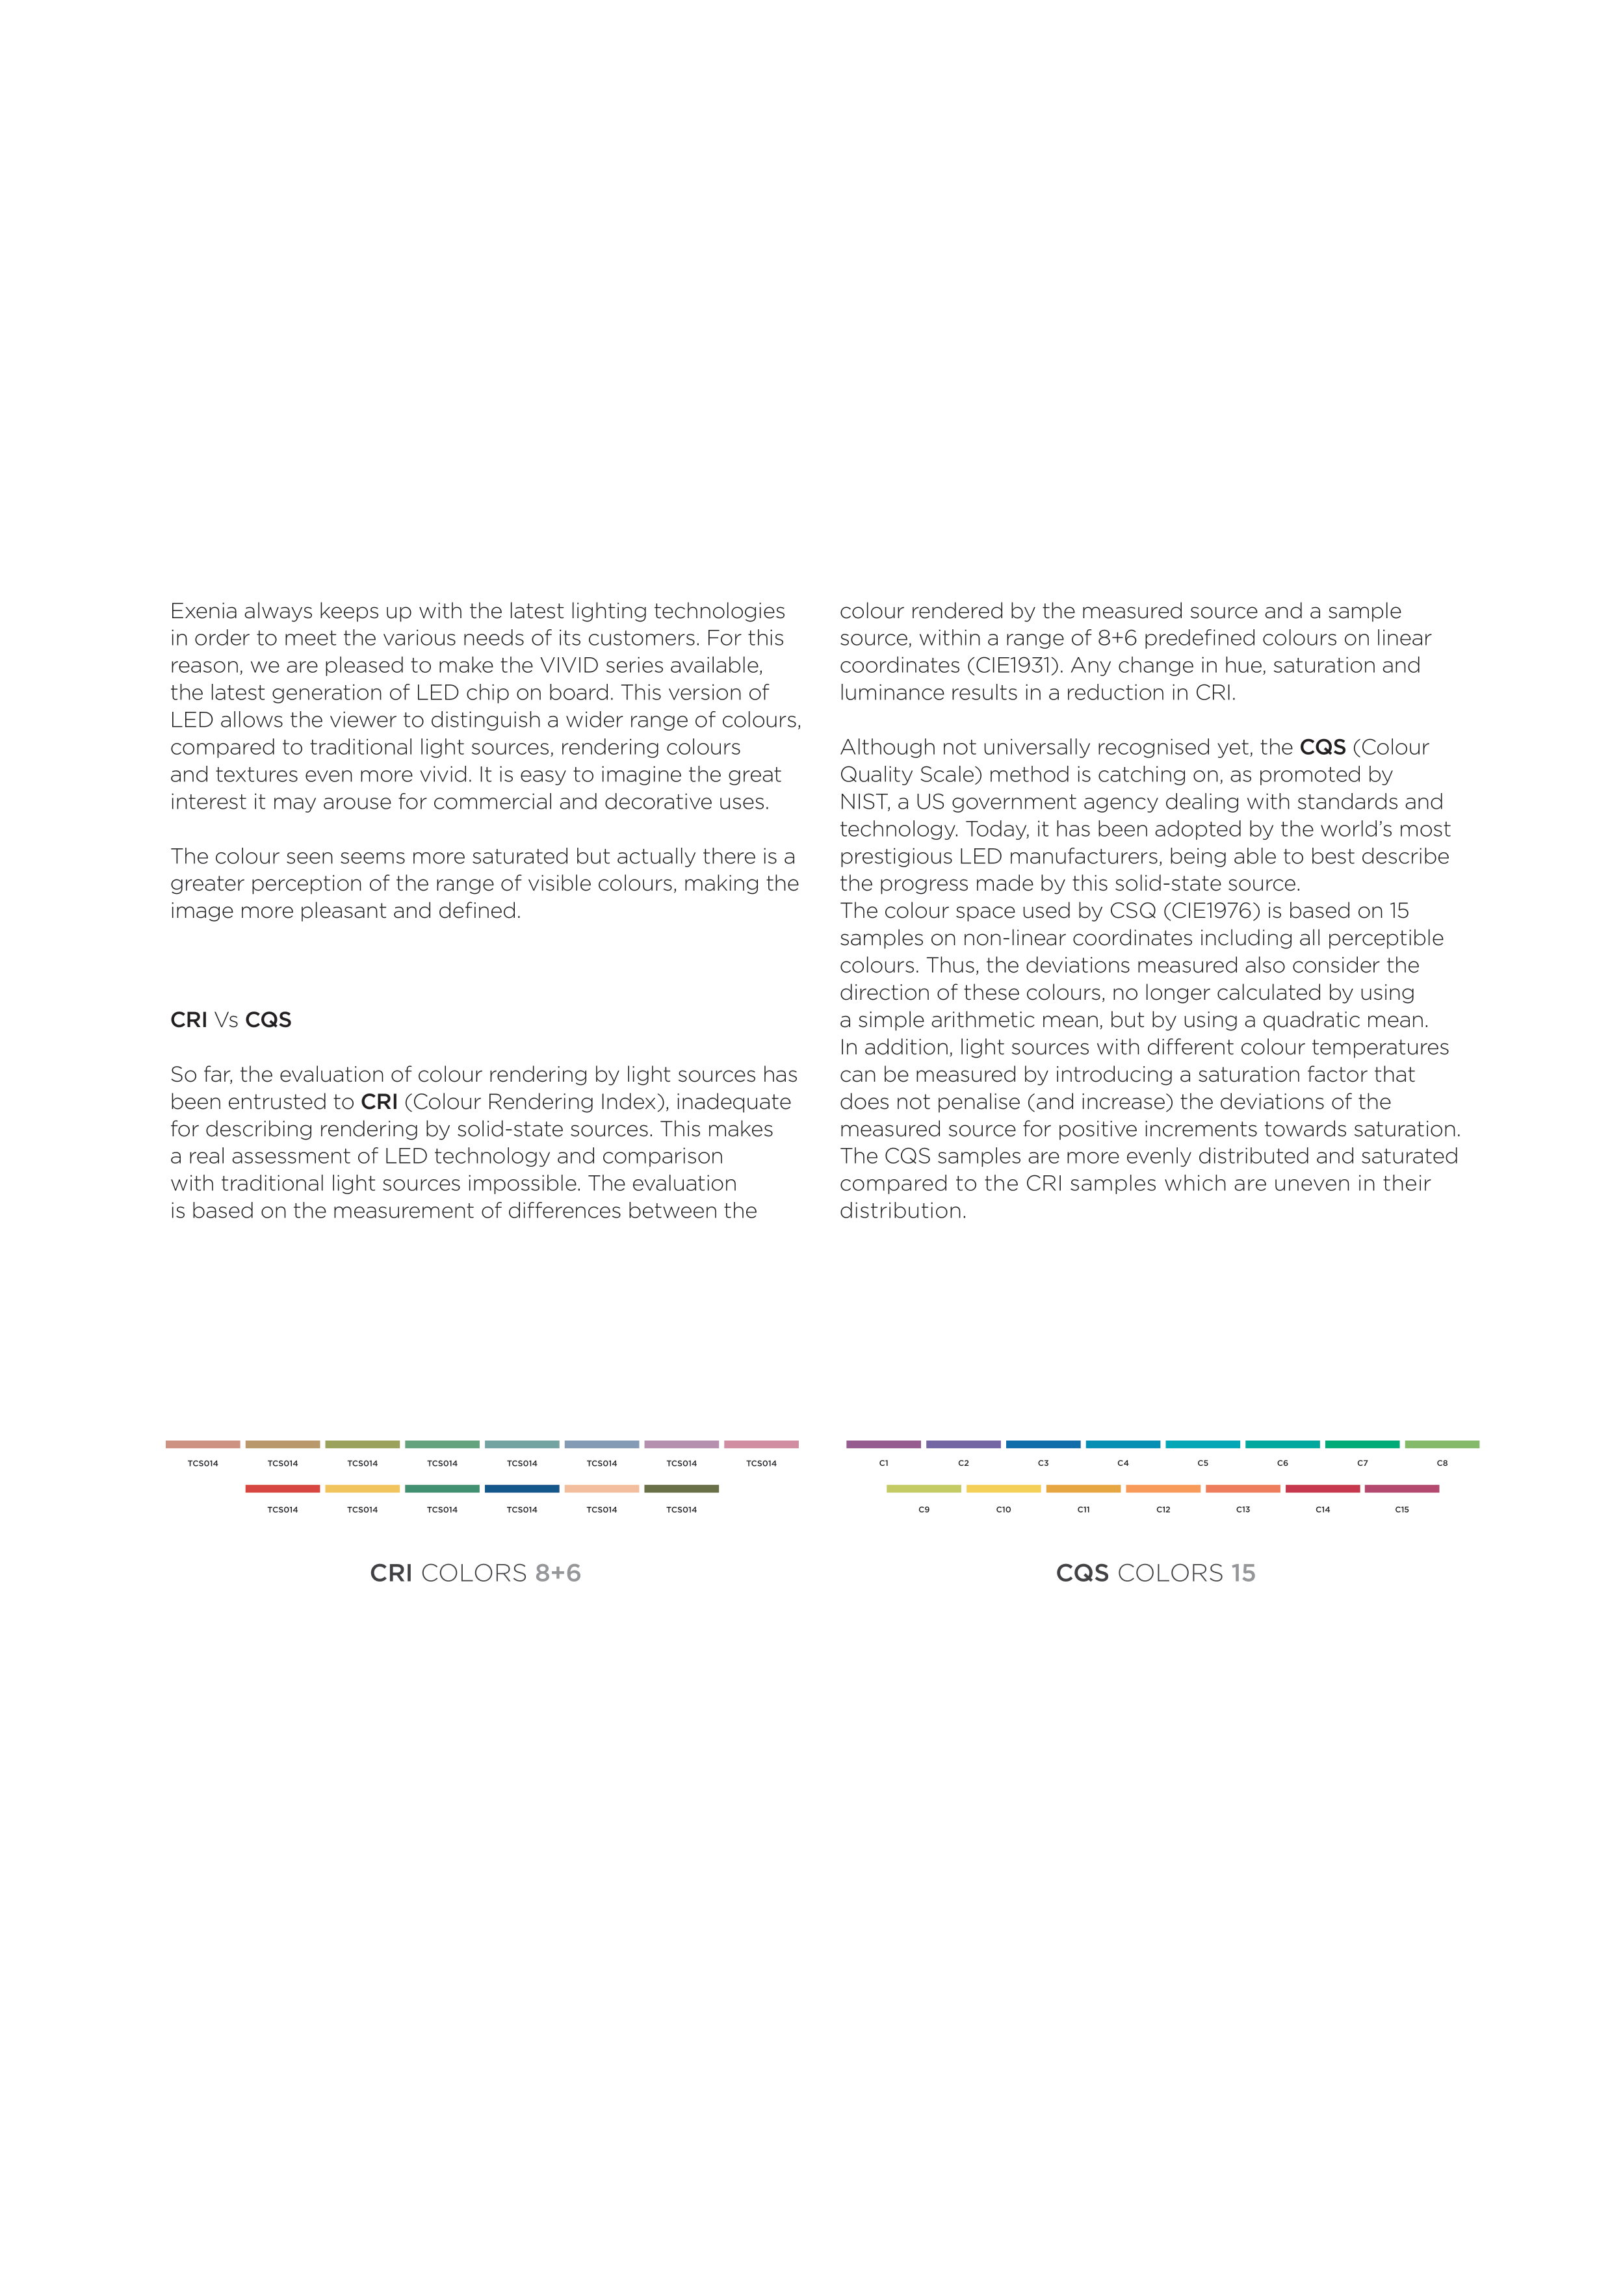
is based on the measurement of diferences between the
colour rendered by the measured source and a sample
source, within a range of 8+6 predefined colours on linear
coordinates (CIE1931). Any change in hue, saturation and
luminance results in a reduction in CRI.
Although not universally recognised yet, the CQS (Colour
Quality Scale) method is catching on, as promoted by
NIST, a US government agency dealing with standards and
technology. Today, it has been adopted by the world’s most
prestigious LED manufacturers, being able to best describe
the progress made by this solid-state source.
The colour space used by CSQ (CIE1976) is based on 15
samples on non-linear coordinates including all perceptible
colours. Thus, the deviations measured also consider the
direction of these colours, no longer calculated by using
a simple arithmetic mean, but by using a quadratic mean.
In addition, light sources with diferent colour temperatures
can be measured by introducing a saturation factor that
does not penalise (and increase) the deviations of the
measured source for positive increments towards saturation.
The CQS samples are more evenly distributed and saturated
compared to the CRI samples which are uneven in their
distribution.
CRI COLORS 8+6
CQS COLORS 15
TCS014
TCS014
TCS014
TCS014
TCS014
TCS014
TCS014
TCS014
TCS014
TCS014
TCS014
TCS014
TCS014
TCS014
C1
C4
C5
C6
C12
C11
C10
C9
C8
C7
C3
C2
C13
C14
C15


