0.44
0.42
0.40
0.38
0.36
0.34
0.34
0.36
0.38
0.40
0.42
0.44
0.46
0.48
0.50
0.52
4000K
3500K
3000K
2700K
0.415
0.410
0.405
0.400
0.395
CIE Y
CIE X
0.425
0.430
0.435
0.440
0.445
0.450
M2
M3
M1
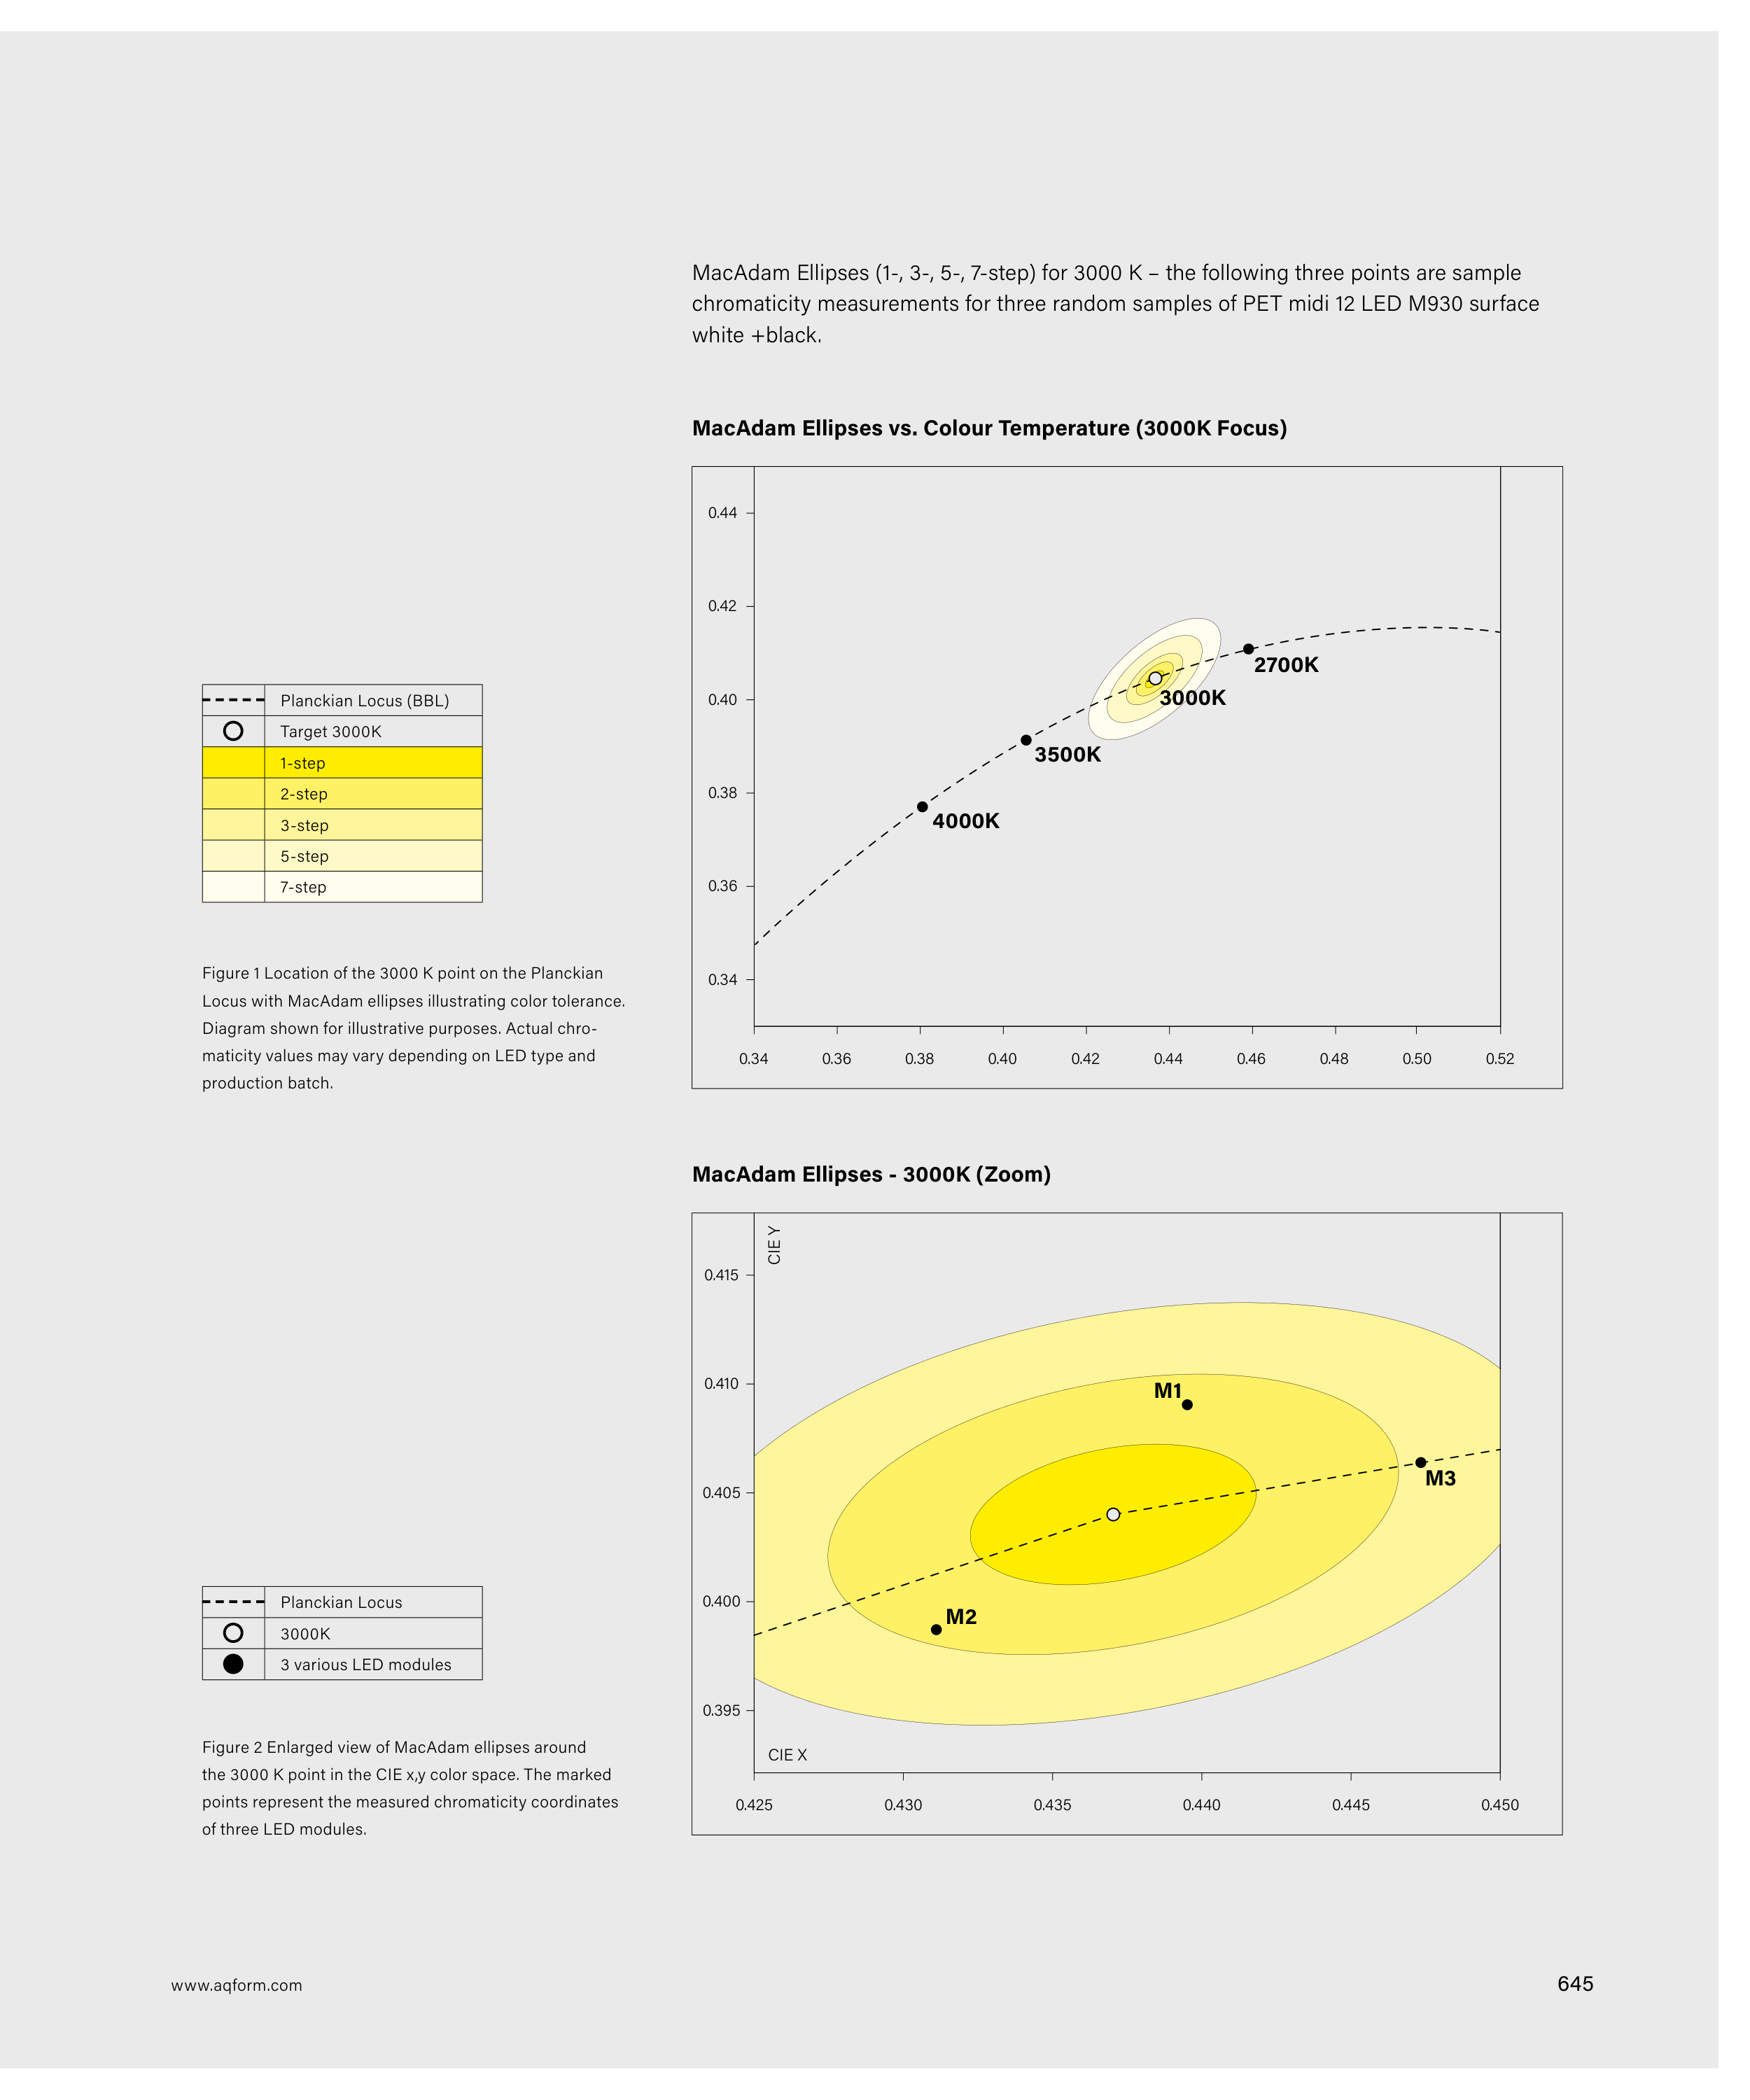
MacAdam Ellipses (1-, 3-, 5-, 7-step) for 3000 K – the following three points are sample
chromaticity measurements for three random samples of PET midi 12 LED M930 surface
white +black.
MacAdam Ellipses vs. Colour Temperature (3000K Focus)
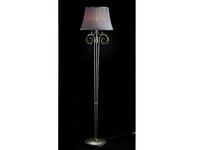
MacAdam Ellipses - 3000K (Zoom)
Figure 1 Location of the 3000 K point on the Planckian
Locus with MacAdam ellipses illustrating color tolerance.
Diagram shown for illustrative purposes. Actual chro-
maticity values may vary depending on LED type and
production batch.
Figure 2 Enlarged view of MacAdam ellipses around
the 3000 K point in the CIE x,y color space. The marked
points represent the measured chromaticity coordinates
of three LED modules.
Planckian Locus (BBL)
Target 3000K
1-step
2-step
3-step
5-step
7-step
Planckian Locus
3000K
3 various LED modules
www.aqform.com
645