lx
10
5
2
1
0,5
0,2
m
0
2
4
6
8
10
12
14
16
18
20
6
4
2
0
8
77 910
LED
H = 4,0 m
2
10
1
0,2
lx
m
0
1
2
3
4
3
2
1
0
4
99853
LED
H = 0,8 m
½ a
½ a
a
6
5
7
8
9
10
11
12
13
14
15
16
17
18
19
20
21
22
23
24
25
26
27
1 lx
1 lx
1 lx
0,5
0,5
0,5
0,5
0,5
When planning pathway lighting, 1 lx is defined as the standard mini-
mum degree of illuminance. Consequently, the 0.5 lx line in the isolux
diagram is relevant for determining the luminaire spacing. This 0.5 lx
must add up to a degree of illuminance on the assessed surface of 1 lx
to define the luminaire spacing.
This results in light point spacing of 6.5 m. During planning, local
conditions such as the colour and characteristics of the ground must
Determining the luminaire spacing “a” for pathway lighting
of Emin = 1 lx on the basis of the isolux diagram
also be taken into consideration. These factors have an enormous influence
on the reflective behaviour of the light and can lead to a visually inadequate
lighting impression even with a standard-compliant degree of illuminance.
An illumination test at the installation site is therefore recommended for
optimal planning results.
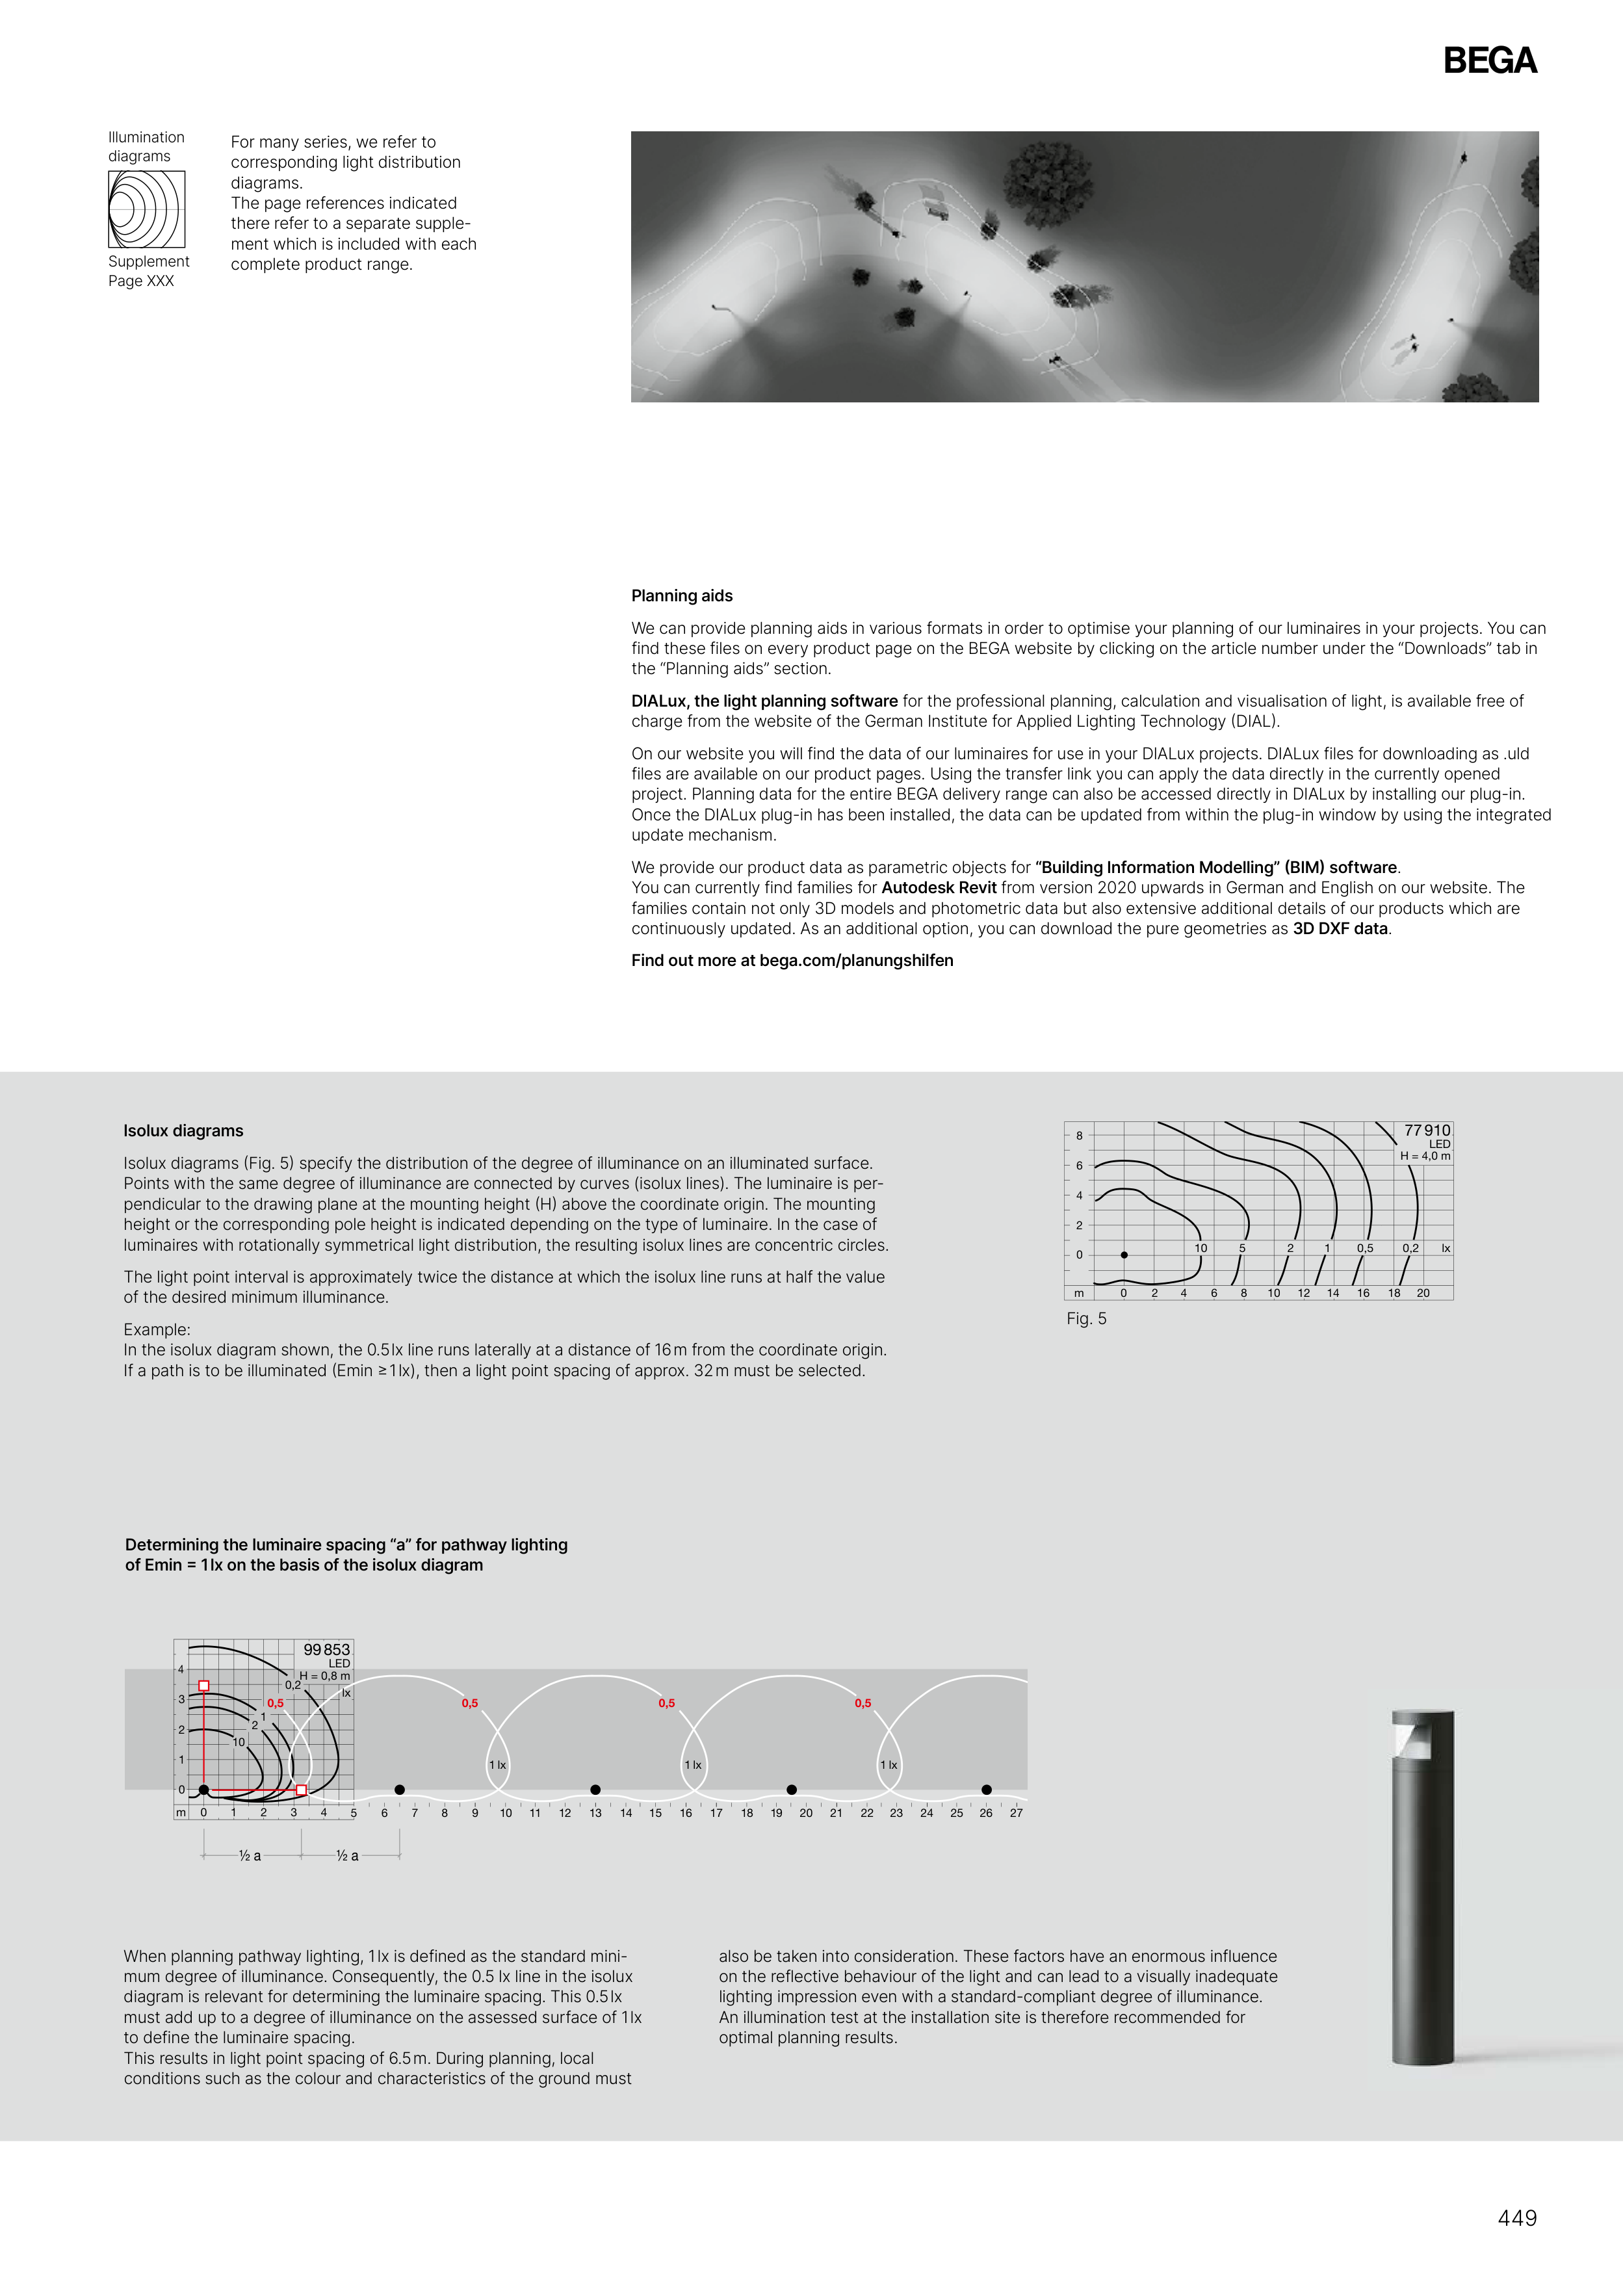
Isolux diagrams
Isolux diagrams (Fig. 5) specify the distribution of the degree of illuminance on an illuminated surface.
Points with the same degree of illuminance are connected by curves (isolux lines). The luminaire is per-
pendicular to the drawing plane at the mounting height (H) above the coordinate origin. The mounting
height or the corresponding pole height is indicated depending on the type of luminaire. In the case of
luminaires with rotationally symmetrical light distribution, the resulting isolux lines are concentric circles.
The light point interval is approximately twice the distance at which the isolux line runs at half the value
of the desired minimum illuminance.
Example:
In the isolux diagram shown, the 0.5 lx line runs laterally at a distance of 16 m from the coordinate origin.
If a path is to be illuminated (Emin ≥ 1 lx), then a light point spacing of approx. 32 m must be selected.
Planning aids
We can provide planning aids in various formats in order to optimise your planning of our luminaires in your projects. You can
find these files on every product page on the BEGA website by clicking on the article number under the “Downloads” tab in
the “Planning aids” section.
DIALux, the light planning software for the professional planning, calculation and visualisation of light, is available free of
charge from the website of the German Institute for Applied Lighting Technology (DIAL).
On our website you will find the data of our luminaires for use in your DIALux projects. DIALux files for downloading as .uld
files are available on our product pages. Using the transfer link you can apply the data directly in the currently opened
project. Planning data for the entire BEGA delivery range can also be accessed directly in DIALux by installing our plug-in.
Once the DIALux plug-in has been installed, the data can be updated from within the plug-in window by using the integrated
update mechanism.
We provide our product data as parametric objects for “Building Information Modelling” (BIM) software.
You can currently find families for Autodesk Revit from version 2020 upwards in German and English on our website. The
families contain not only 3D models and photometric data but also extensive additional details of our products which are
continuously updated. As an additional option, you can download the pure geometries as 3D DXF data.
Find out more at bega.com/planungshilfen
Fig. 5
For many series, we refer to
corresponding light distribution
diagrams.
The page references indicated
there refer to a separate supple-
ment which is included with each
complete product range.
Supplement
Page XXX
Illumination
diagrams
449