15%
85%
65,5%
35,5 %
- 4,2 %
1,5 %
1,6 %
0,1 %
and are positioned in the matrix according to their relevance for
the Group and its stakeholders in light of the markets in which the
Group operates.
Artemide’s product offering strives for sustainability, implementing
innovations that seek to improve products’ energy efficiency by
reducing their energy consumption.
Through its activities, Artemide generates economic resources
that are subsequently distributed among the main categories of
stakeholders such as employees, shareholders, its communities
and the public administration, in the form of raw material
purchases, employee salaries and tax contributions.
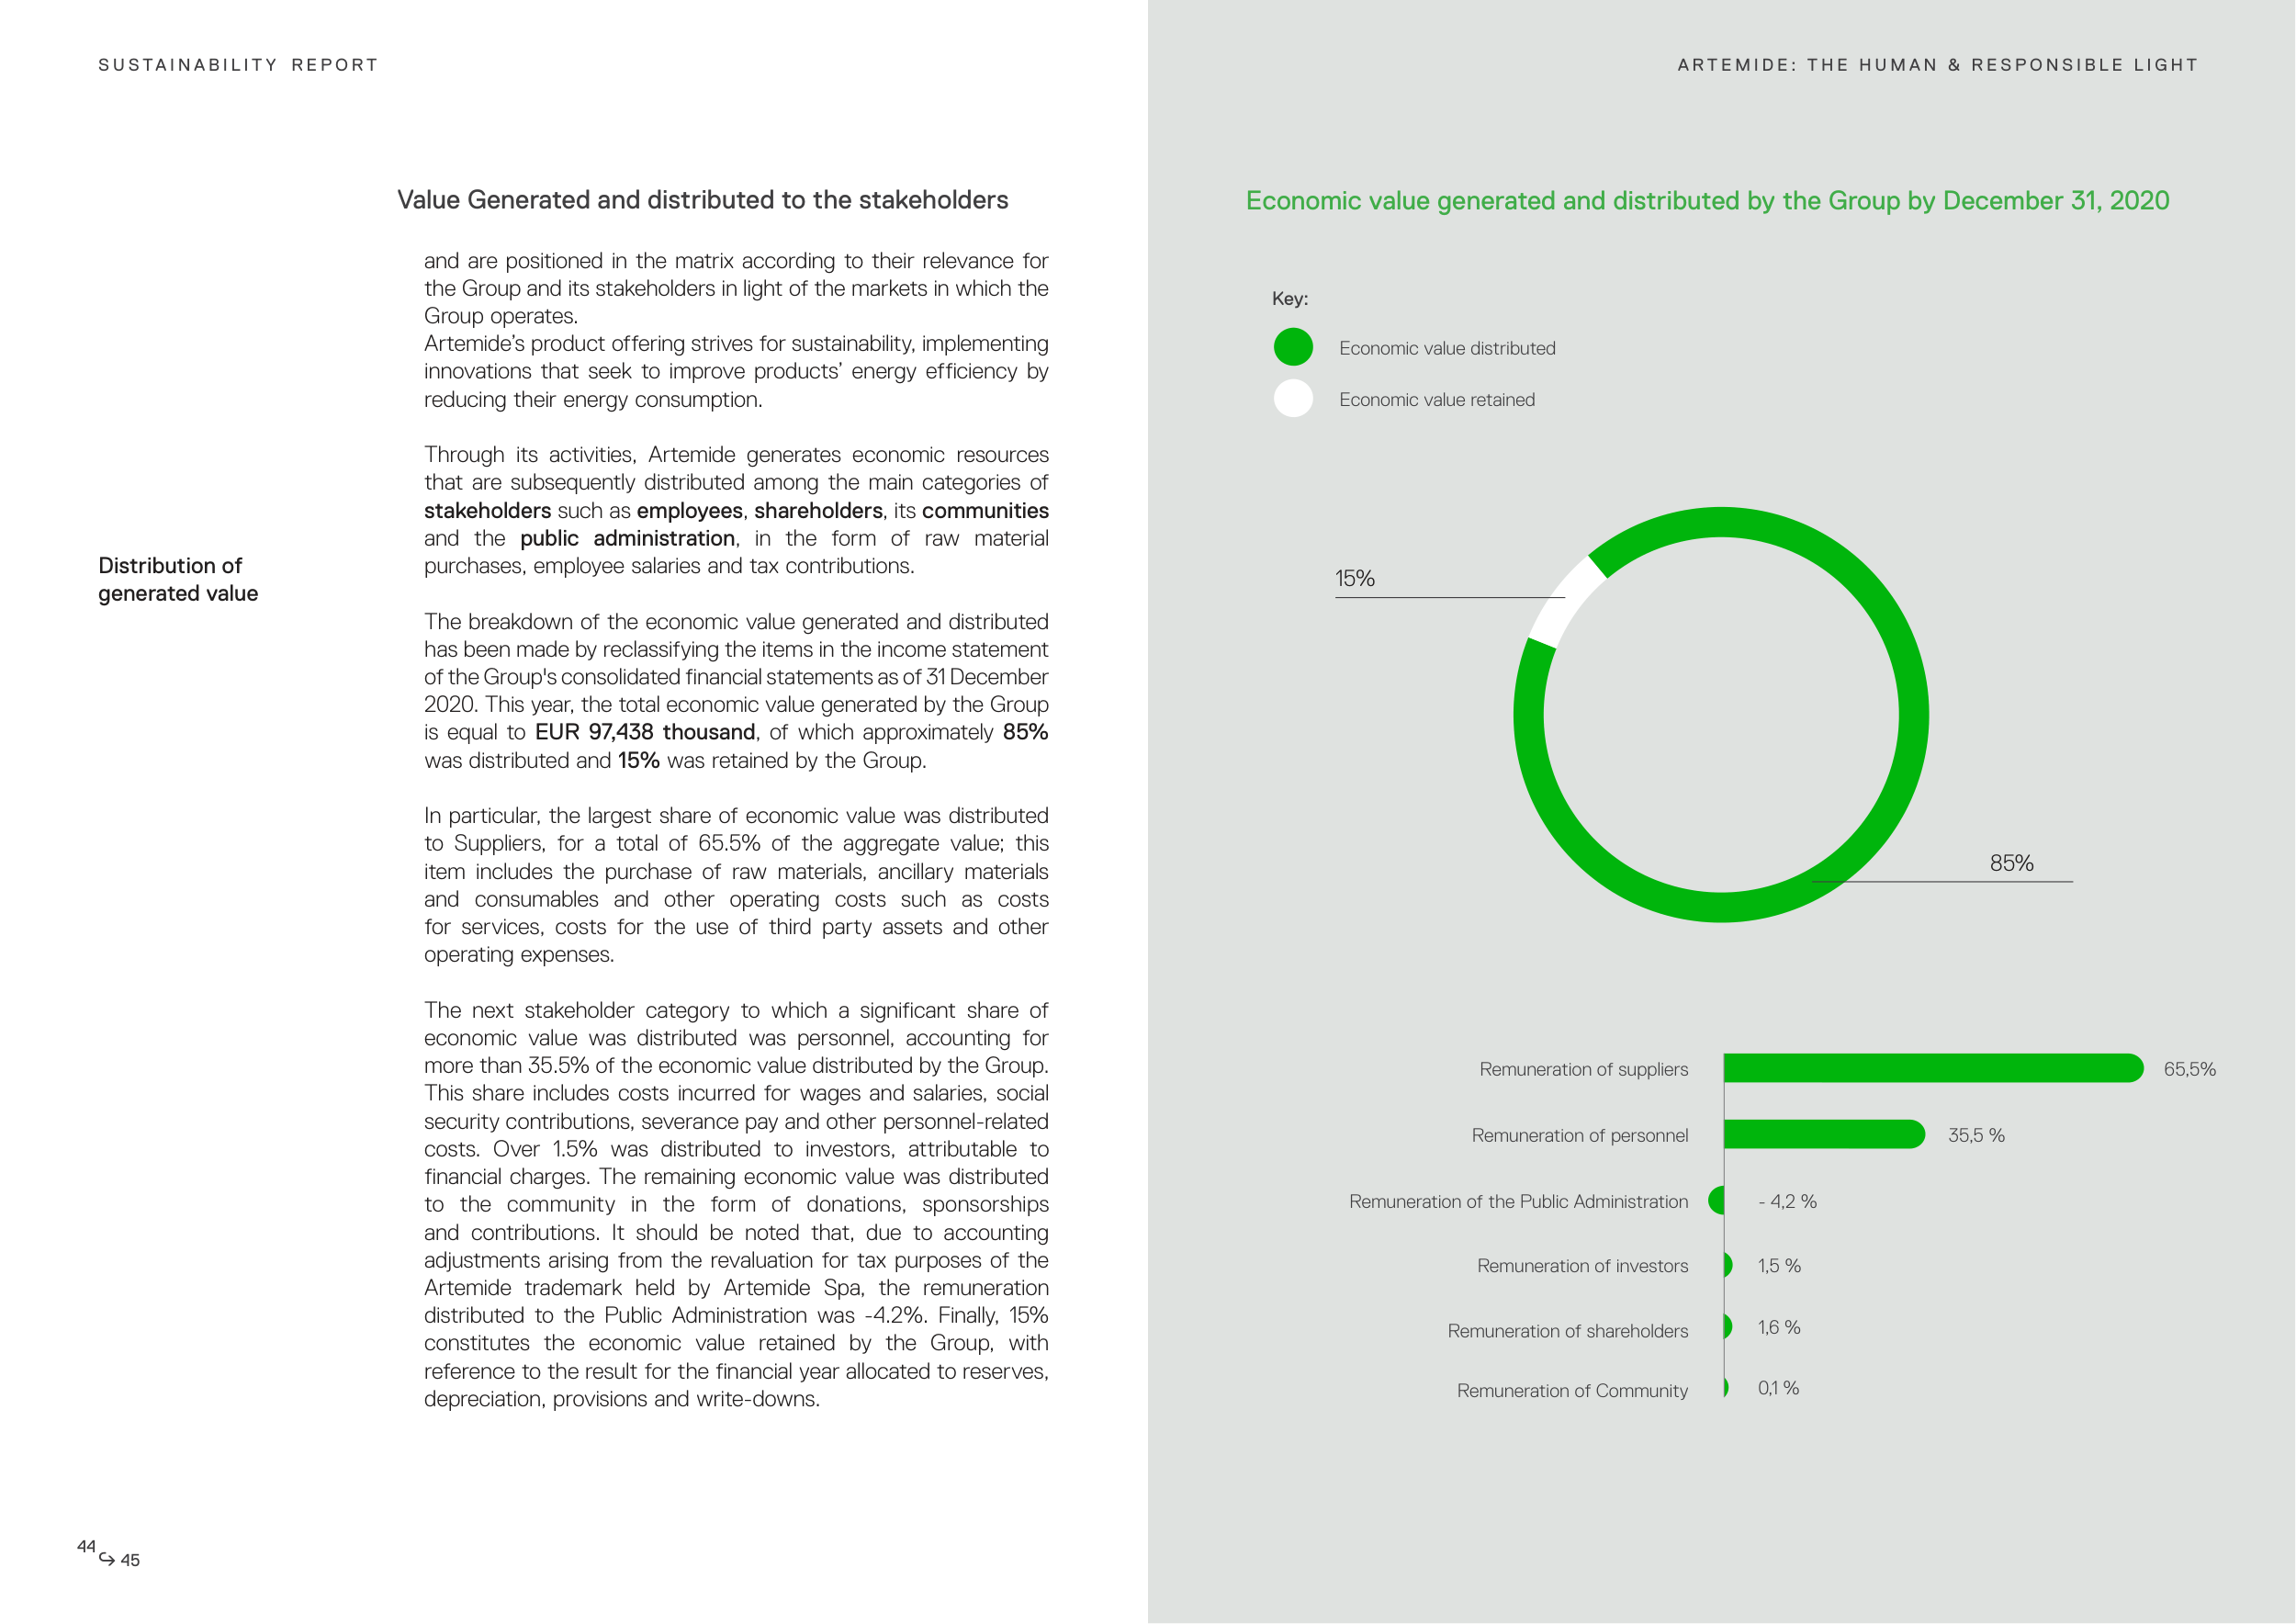
The breakdown of the economic value generated and distributed
has been made by reclassifying the items in the income statement
of the Group's consolidated financial statements as of 31 December
2020. This year, the total economic value generated by the Group
is equal to EUR 97,438 thousand, of which approximately 85%
was distributed and 15% was retained by the Group.
In particular, the largest share of economic value was distributed
to Suppliers, for a total of 65.5% of the aggregate value; this
item includes the purchase of raw materials, ancillary materials
and consumables and other operating costs such as costs
for services, costs for the use of third party assets and other
operating expenses.
The next stakeholder category to which a significant share of
economic value was distributed was personnel, accounting for
more than 35.5% of the economic value distributed by the Group.
This share includes costs incurred for wages and salaries, social
security contributions, severance pay and other personnel-related
costs. Over 1.5% was distributed to investors, attributable to
financial charges. The remaining economic value was distributed
to the community in the form of donations, sponsorships
and contributions. It should be noted that, due to accounting
adjustments arising from the revaluation for tax purposes of the
Artemide trademark held by Artemide Spa, the remuneration
distributed to the Public Administration was -4.2%. Finally, 15%
constitutes the economic value retained by the Group, with
reference to the result for the financial year allocated to reserves,
depreciation, provisions and write-downs.
Value Generated and distributed to the stakeholders
Distribution of
generated value
Economic value generated and distributed by the Group by December 31, 2020
Economic value distributed
Economic value retained
Remuneration of suppliers
Remuneration of personnel
Remuneration of investors
Remuneration of the Public Administration
Remuneration of shareholders
Remuneration of Community
Key:
A R T E M I D E : T H E H U M A N & R E S P O N S I B L E L I G H T
S U S TA I N A B I L I T Y R E P O R T
44
45