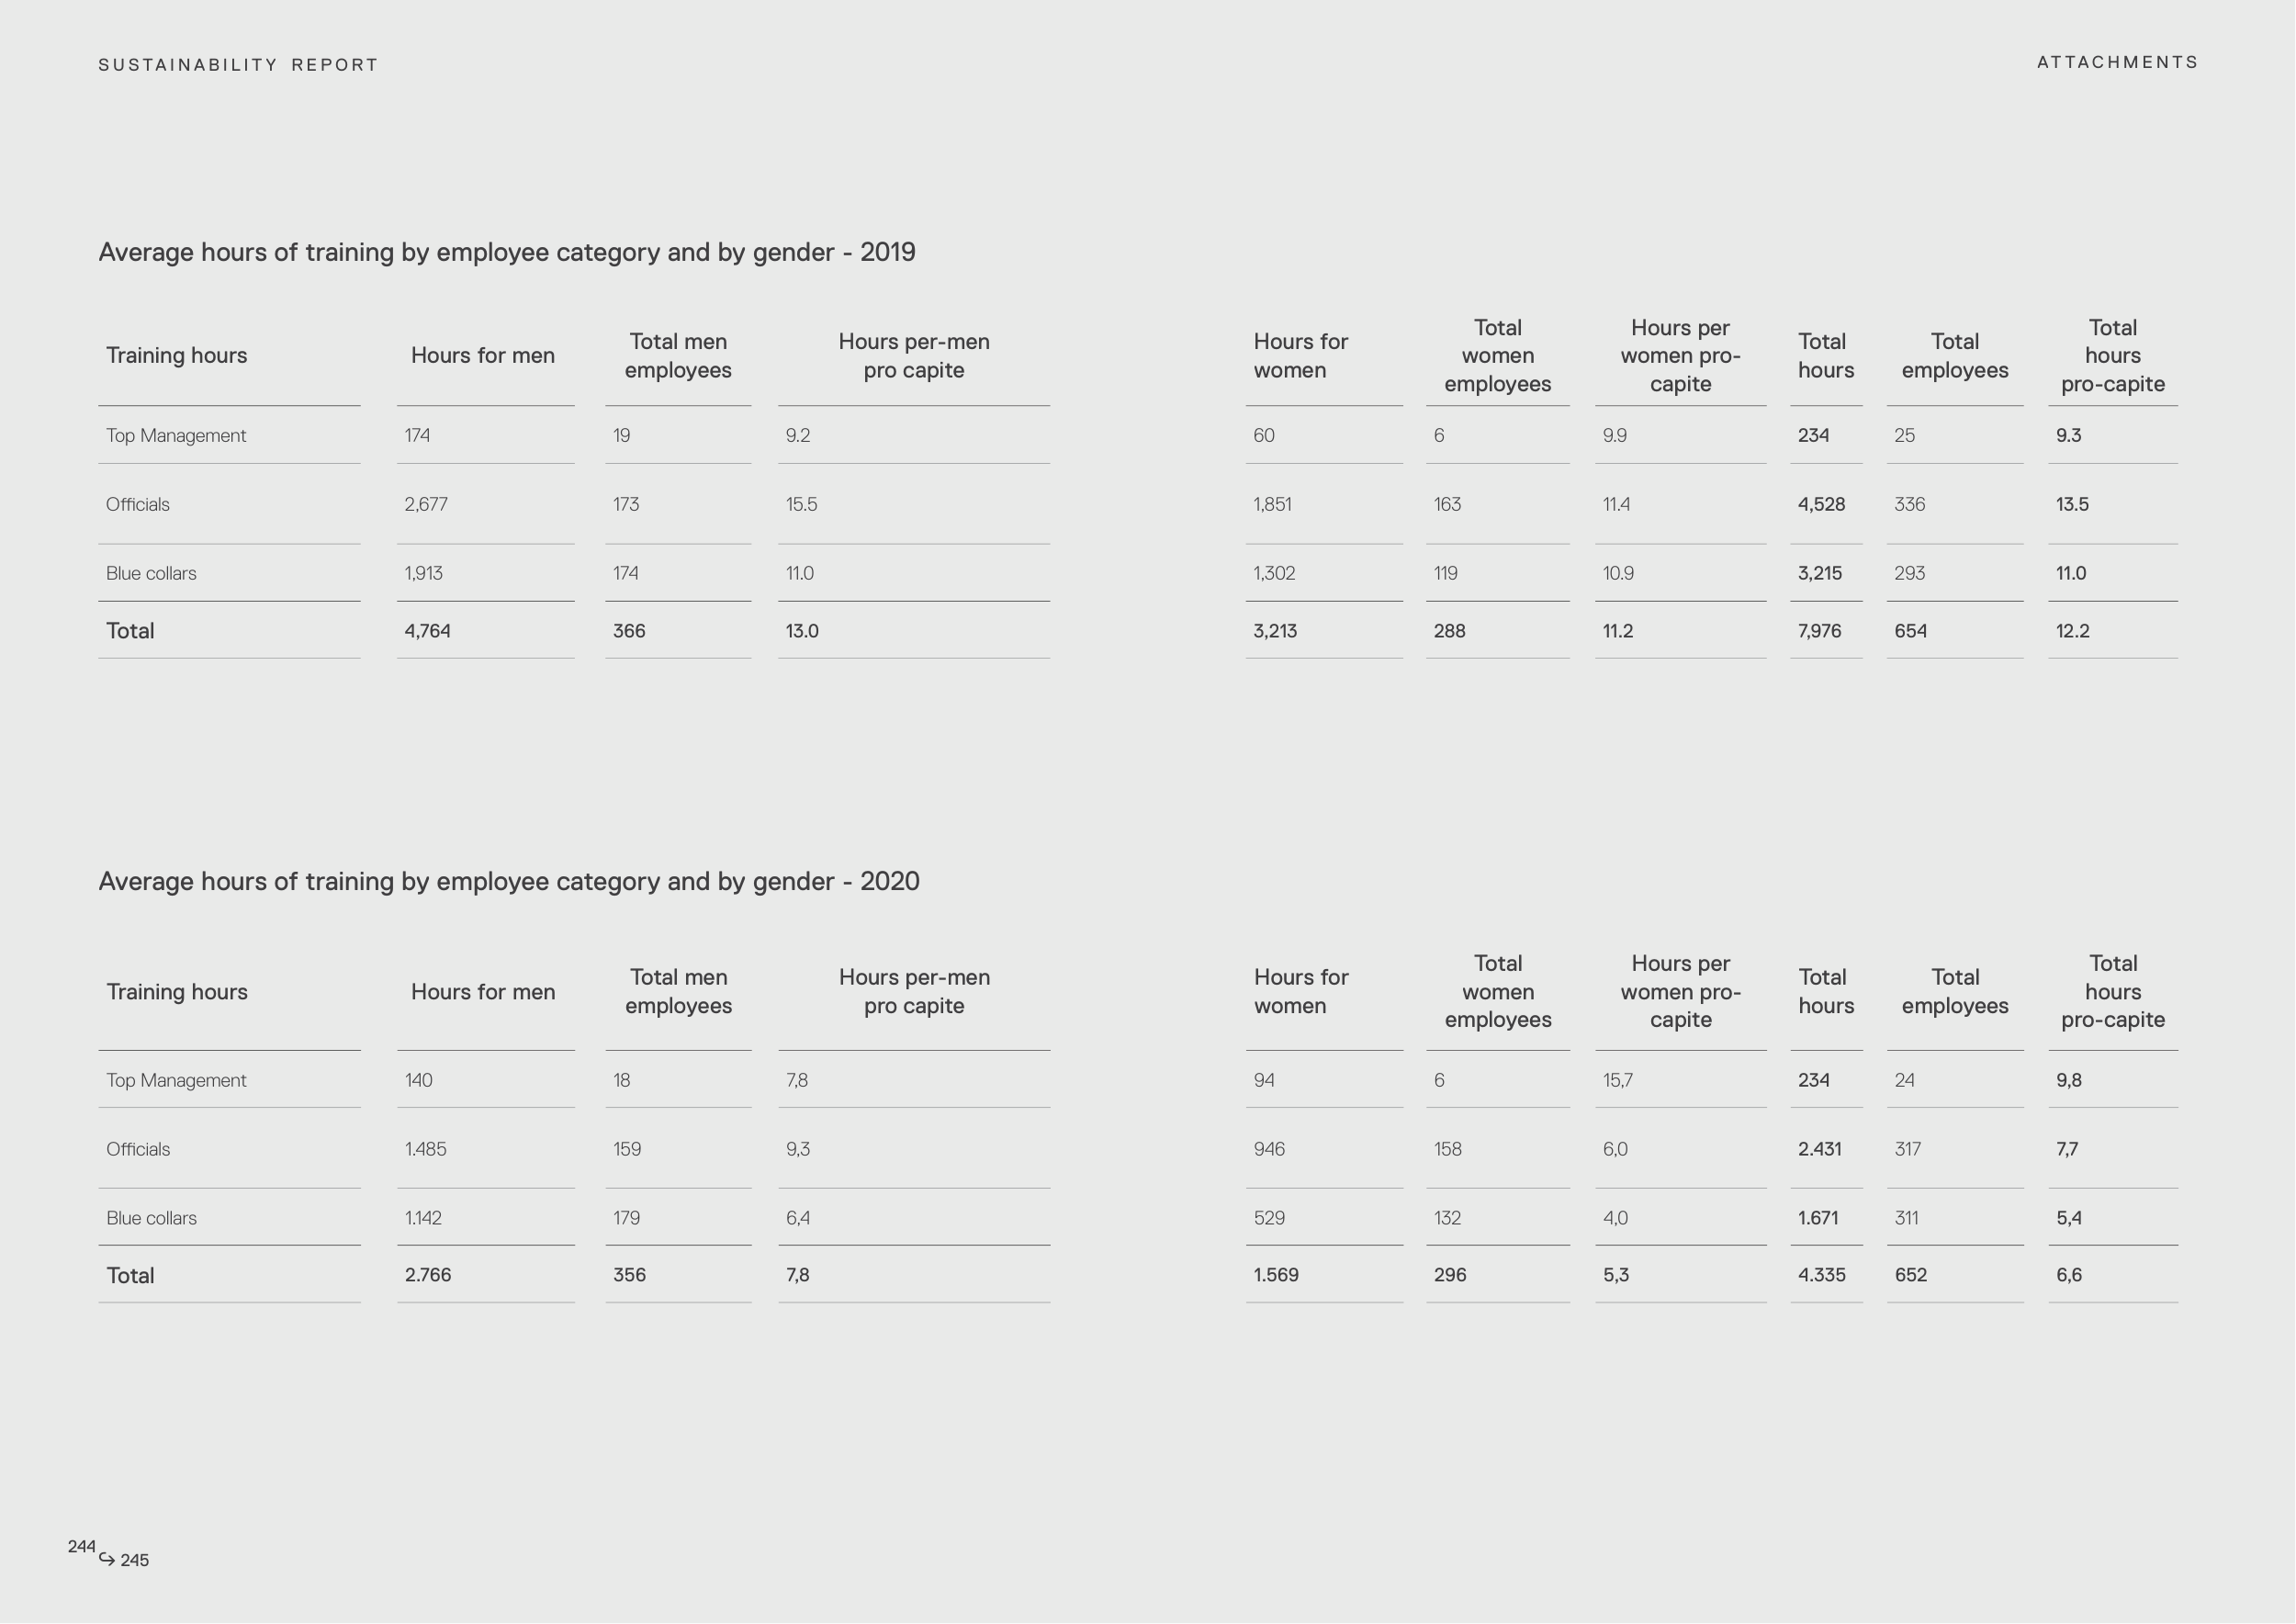
Average hours of training by employee category and by gender - 2019
Average hours of training by employee category and by gender - 2020
Training hours
Hours for men
Total men
employees
Hours per-men
pro capite
Hours for
women
Total
women
employees
Hours per
women pro-
capite
Total
hours
Total
employees
Total
hours
pro-capite
Top Management
140
18
7,8
94
6
15,7
234
24
9,8
Officials
1.485
159
9,3
946
158
6,0
2.431
317
7,7
Blue collars
1.142
179
6,4
529
132
4,0
1.671
311
5,4
Total
2.766
356
7,8
1.569
296
5,3
4.335
652
6,6
Training hours
Hours for men
Total men
employees
Hours per-men
pro capite
Hours for
women
Total
women
employees
Hours per
women pro-
capite
Total
hours
Total
employees
Total
hours
pro-capite
Top Management
174
19
9.2
60
6
9.9
234
25
9.3
Officials
2,677
173
15.5
1,851
163
11.4
4,528
336
13.5
Blue collars
1,913
174
11.0
1,302
119
10.9
3,215
293
11.0
Total
4,764
366
13.0
3,213
288
11.2
7,976
654
12.2
AT TA C H M E N T S
S U S TA I N A B I L I T Y R E P O R T
244
245