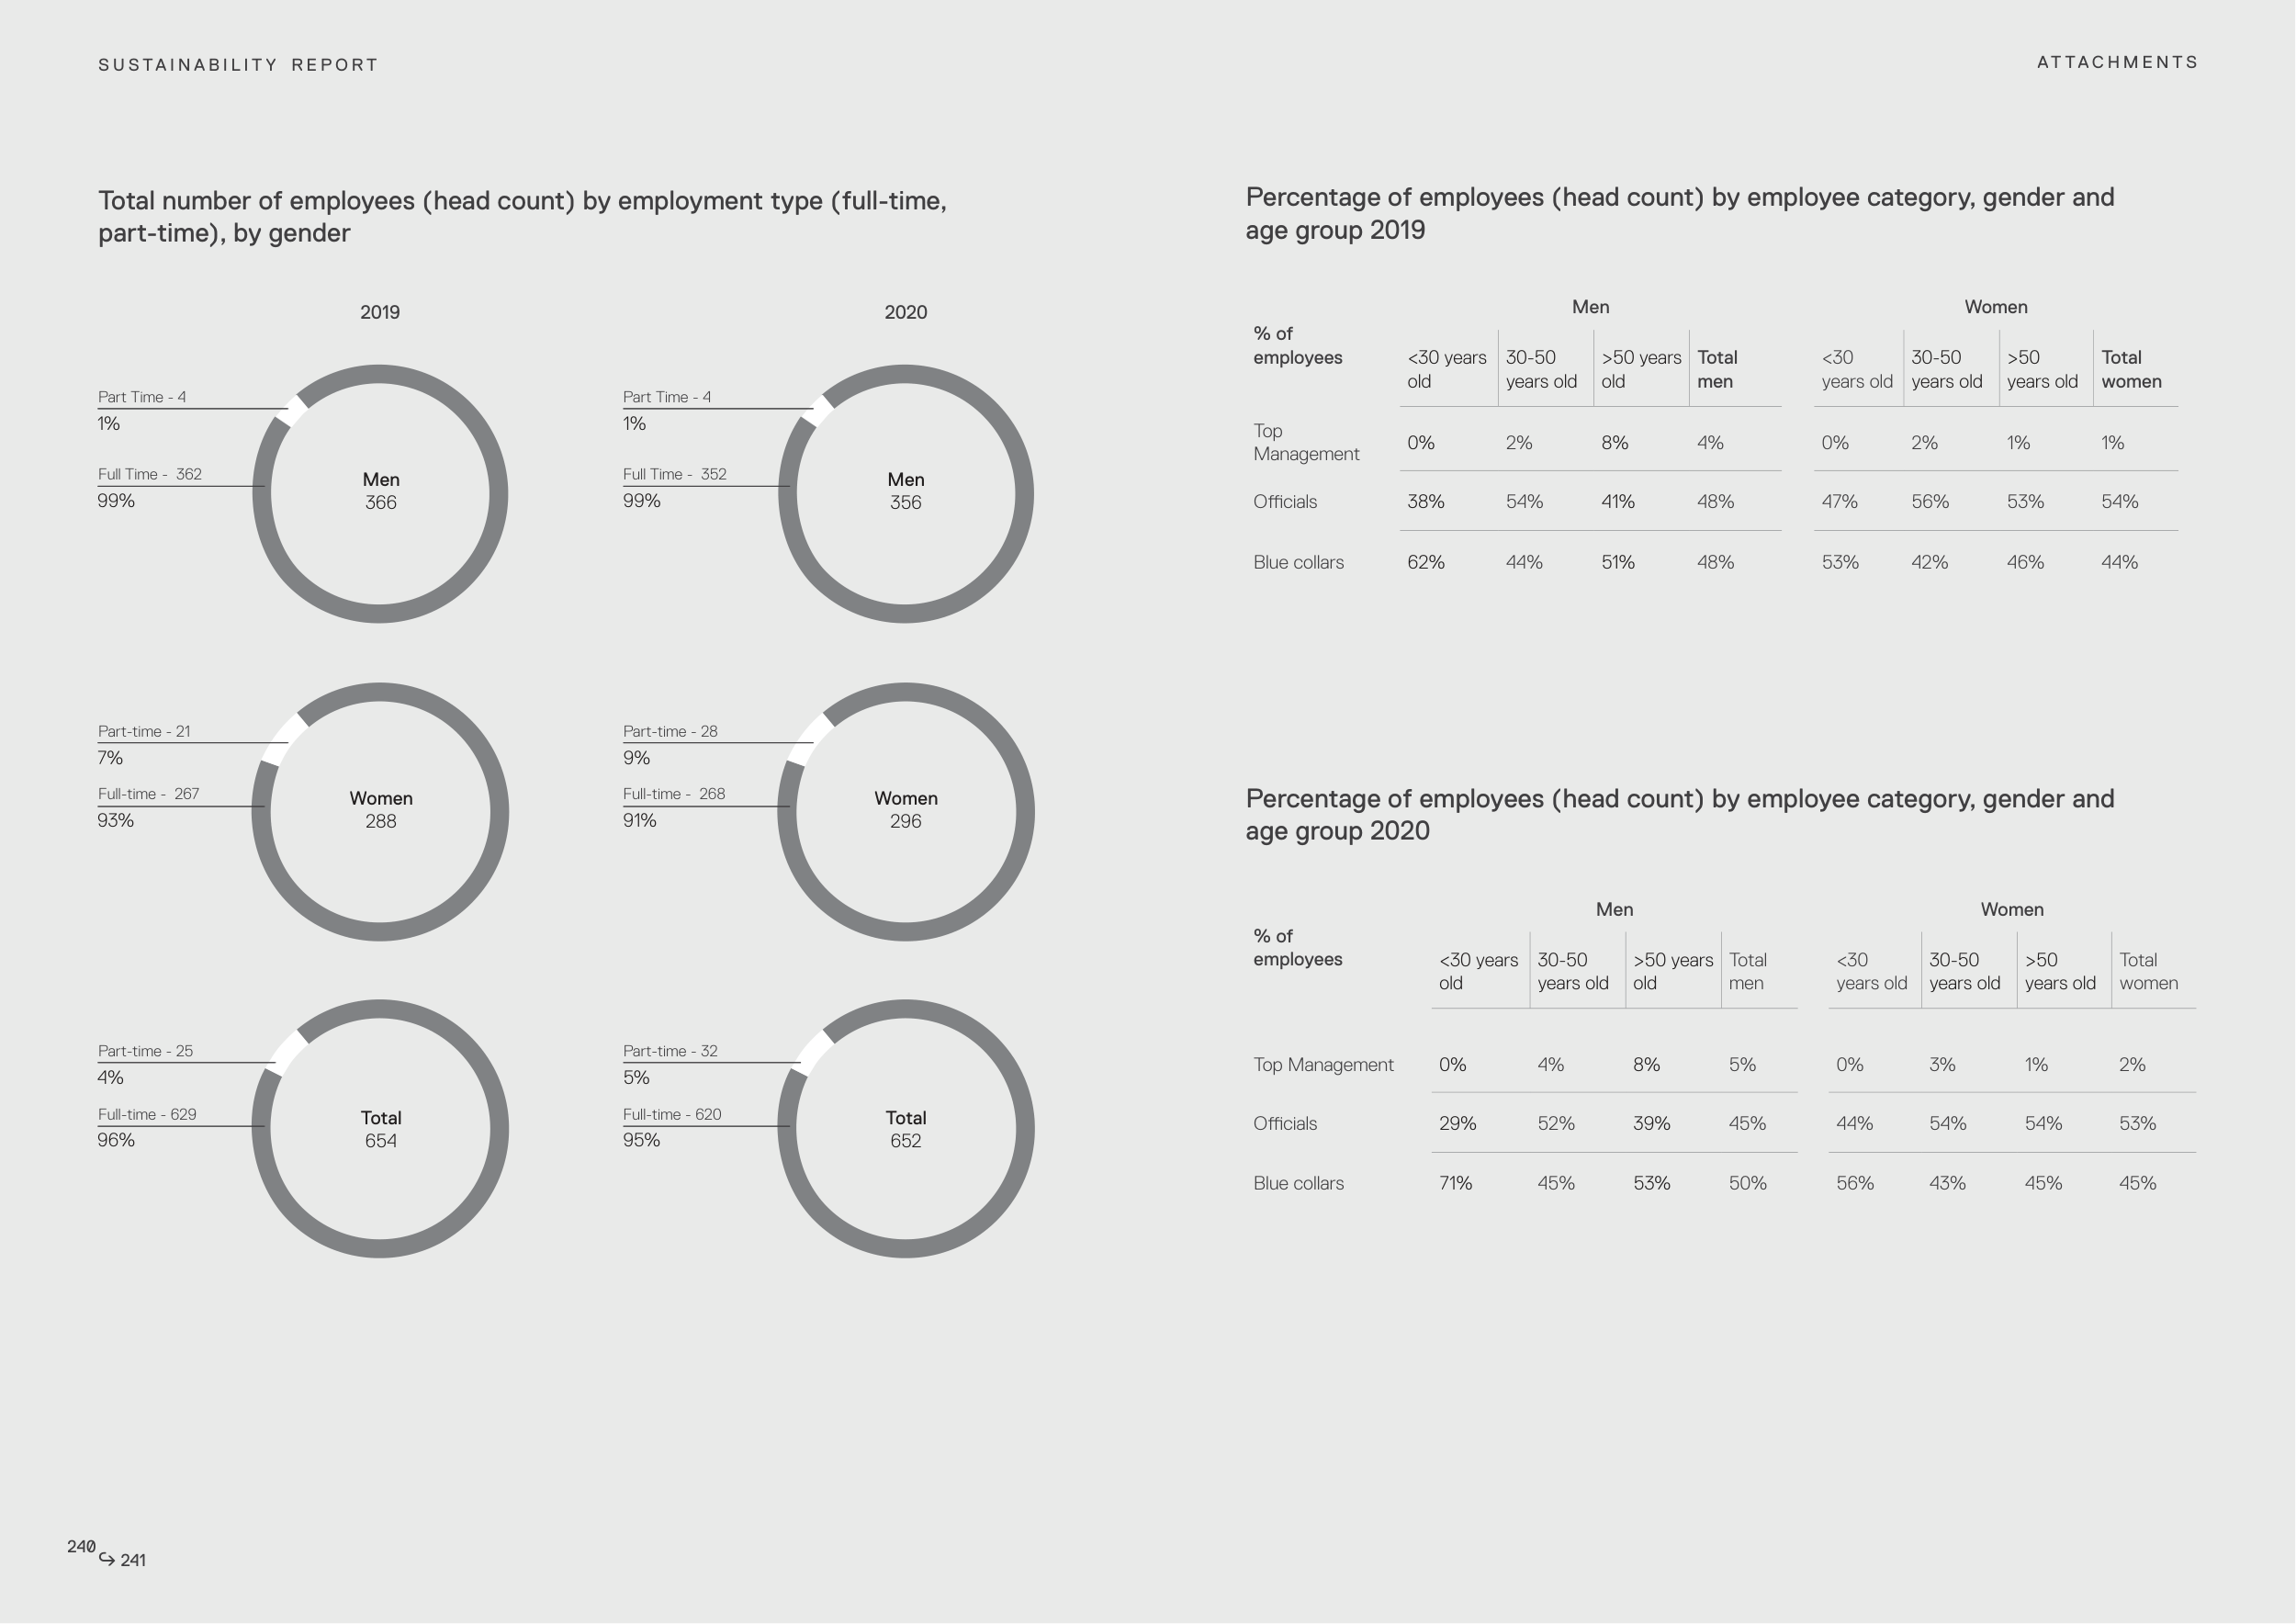
2020
2019
1%
1%
9%
7%
5%
4%
99%
99%
91%
93%
95%
96%
Full Time - 362
Full Time - 352
Full-time - 267
Full-time - 268
Full-time - 629
Full-time - 620
Part Time - 4
Part Time - 4
Part-time - 21
Part-time - 28
Part-time - 25
Part-time - 32
Men
366
Men
356
Women
288
Women
296
Total
654
Total
652
Total number of employees (head count) by employment type (full-time,
part-time), by gender
Percentage of employees (head count) by employee category, gender and
age group 2020
Percentage of employees (head count) by employee category, gender and
age group 2019
% of
employees
Men
Women
<30 years
old
30-50
years old
>50 years
old
Total
men
<30
years old
30-50
years old
>50
years old
Total
women
Top
Management
0%
2%
8%
4%
0%
2%
1%
1%
Officials
38%
54%
41%
48%
47%
56%
53%
54%
Blue collars
62%
44%
51%
48%
53%
42%
46%
44%
AT TA C H M E N T S
% of
employees
Men
Women
<30 years
old
30-50
years old
>50 years
old
Total
men
<30
years old
30-50
years old
>50
years old
Total
women
Top Management
0%
4%
8%
5%
0%
3%
1%
2%
Officials
29%
52%
39%
45%
44%
54%
54%
53%
Blue collars
71%
45%
53%
50%
56%
43%
45%
45%
S U S TA I N A B I L I T Y R E P O R T
240
241