Photometric curve in polar coordinates
It represents the light intensity distribution
(in candles/1000 lumen) emitted by the light fixture
on the planes passing through its optical axis.
Two curves are indicated for each light fixture.
The first one refers to the transversal C0-C180
plane (continuous line) and the second one to the
longitudinal C90-C270 plane (broken line).
The photometric curve defines the lighting engineer-
ing features of the fixture, such as the luminous flux
control, the type of emission, the maximum intensity
direction, which are needed for testing illuminance
values during use.
Photometric curves shown in this catalogue are only
indicative. For accurate photometric data, calculations
should be taken from Dialux programme.
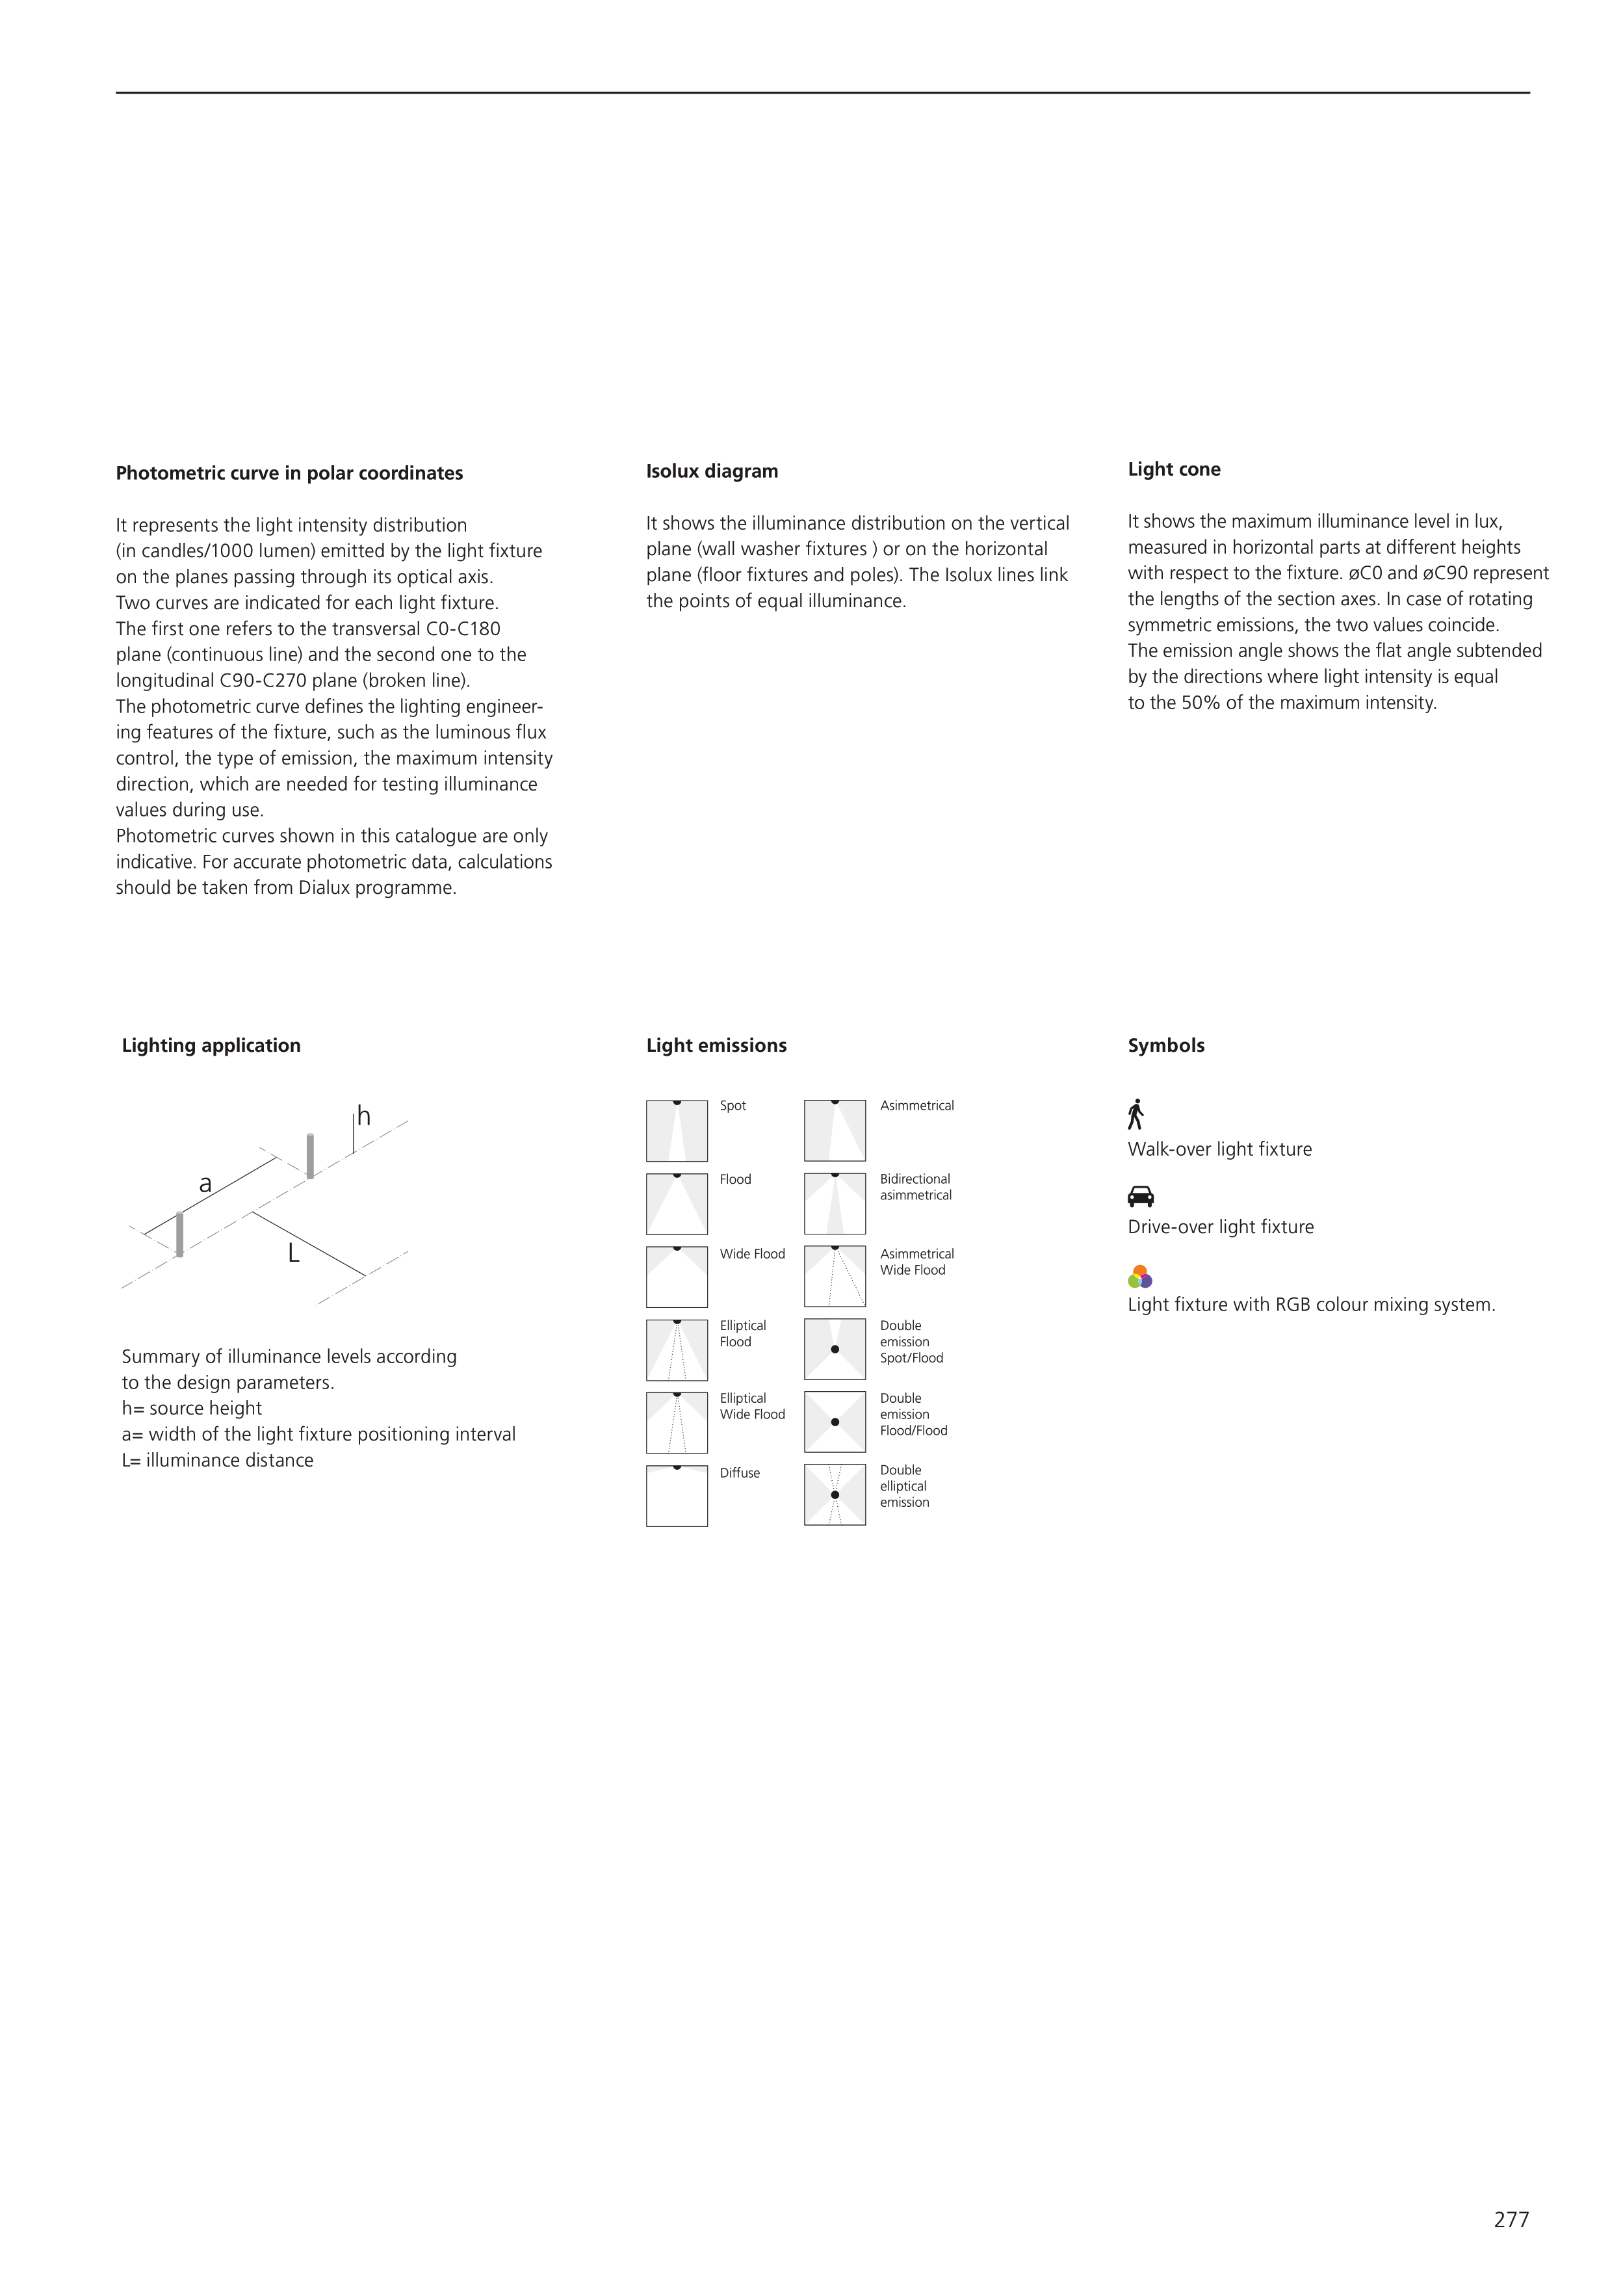
Lighting application
a
h
L
Summary of illuminance levels according
to the design parameters.
h= source height
a= width of the light fixture positioning interval
L= illuminance distance
Light emissions
Spot
Flood
Wide Flood
Asimmetrical
Bidirectional
asimmetrical
Asimmetrical
Wide Flood
Double
emission
Spot/Flood
Double
emission
Flood/Flood
Double
elliptical
emission
Elliptical
Flood
Elliptical
Wide Flood
Diffuse
Isolux diagram
It shows the illuminance distribution on the vertical
plane (wall washer fixtures ) or on the horizontal
plane (floor fixtures and poles). The Isolux lines link
the points of equal illuminance.
Light cone
It shows the maximum illuminance level in lux,
measured in horizontal parts at different heights
with respect to the fixture. øC0 and øC90 represent
the lengths of the section axes. In case of rotating
symmetric emissions, the two values coincide.
The emission angle shows the flat angle subtended
by the directions where light intensity is equal
to the 50% of the maximum intensity.
Symbols
Walk-over light fixture
Drive-over light fixture
Light fixture with RGB colour mixing system.
277


